Dow Jones Industrial Average continues to hold at familiar levels ahead of Jackson Hole
- Dow Jones continues to churn just below 41,000.00.
- Equities continue to look for further signs of rate cuts from Fed.
- NFP payroll adjustments have bolstered bets of 100 bps in 2024.

The Dow Jones Industrial Average churned in the midrange on Wednesday as markets buckle down for the wait to the kickoff of this year’s annual Jackson Hole Economic Summit on Thursday. Markets continue to look for firmer signs of the Federal Reserve (Fed) getting pushed into a rate cutting cycle in September, with bets on the rise of a 100 bps rate trim on September 18.
According to the CME’s FedWatch Tool, rate markets kicked up their bets of a double rate cut from the Fed in September after the Bureau of Labor Statistics (BLS) reported a steep downside revision to Nonfarm Payroll (NFP) figures initially released in March. The BLS knocked over 800K jobs off of the March jobs report retroactively, sending rate trader bets of a 100 bps initial cut on September 18 up to roughly a third, with the remainder of the rate markets still expecting at least a 25 bps trim.
Rate market bets of a September double cut went even higher, to nearly 40%, after the Federal Open Market Committee's (FOMC) latest Meeting Minutes revealed that policymakers had already begun the process of discussing rate cuts as early as July, with many participants noting that softening labor conditions plus the current state of the battle against inflation may warrant movement on rate cuts sooner rather than later.
Dow Jones news
Despite testing middling waters, most of the Dow Jones found gains on Wednesday, with less than a third of the equity board declining during the midweek market session. American Express Co. (AXP) fell 3.3% to $244.62 per share, while 3M Co. (MMM) climbed around 1.5% to test $130.00 per share.
Read more: American Express suffers as Bank of America downgrades AXP on slower growth
Dow Jones price forecast
The Dow Jones is set to price in another middling day on Wednesday, and is poised to pop a spinning top candlestick after chalking in one of the index’s best weeks of the year. This week’s price action snapped a five-day winning streak, but bidding pressure continues to simmer as a pullback has yet to materialize.
Dow Jones daily chart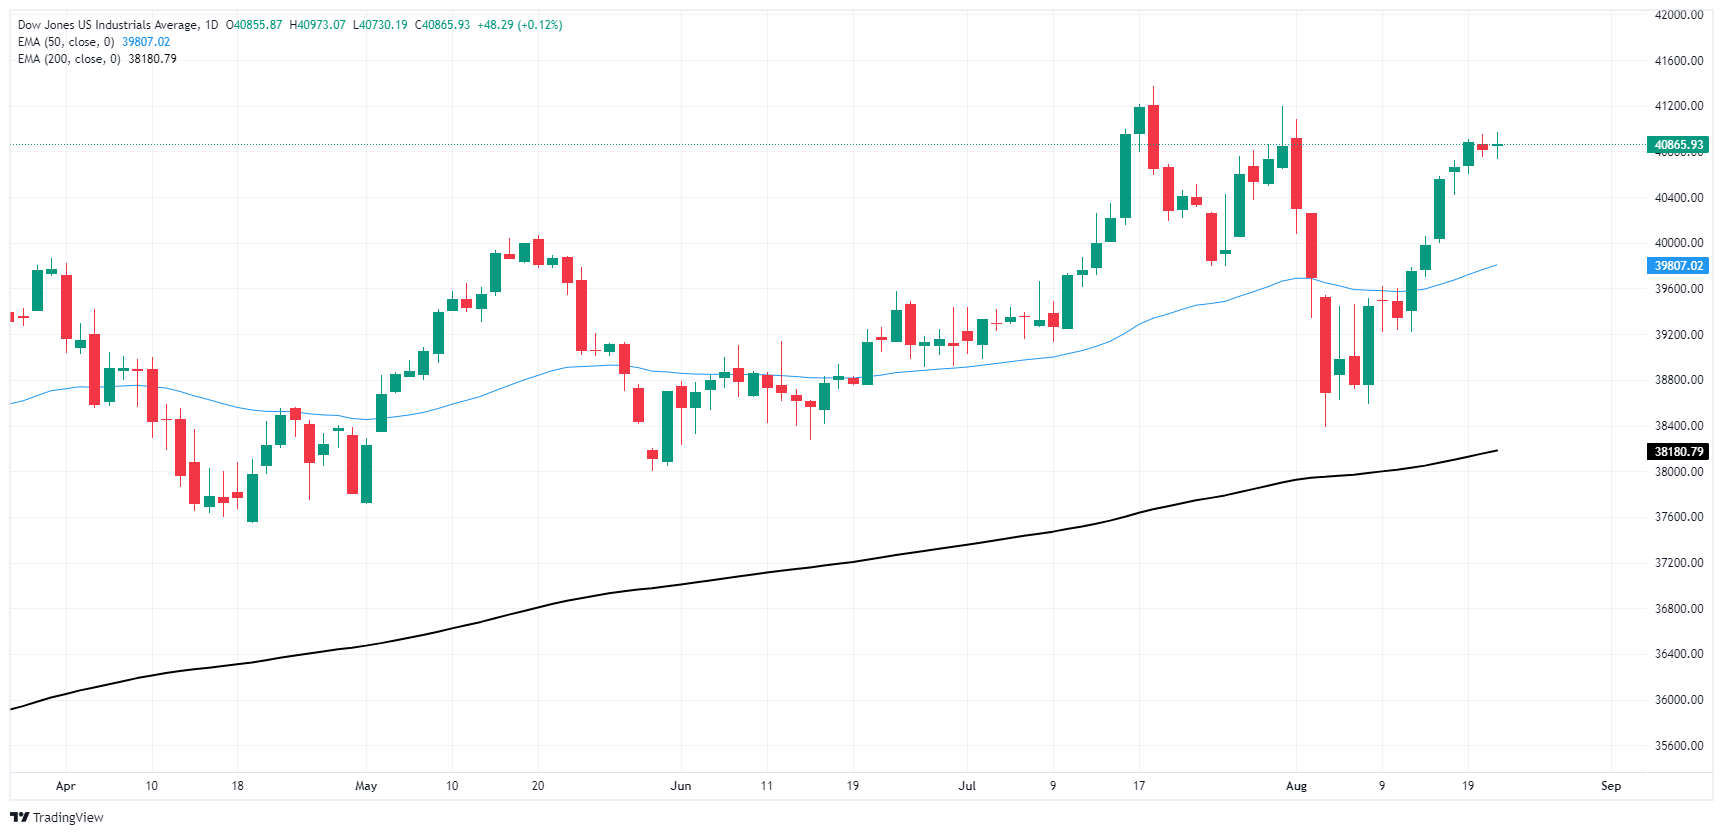
Dow Jones FAQs
The Dow Jones Industrial Average, one of the oldest stock market indices in the world, is compiled of the 30 most traded stocks in the US. The index is price-weighted rather than weighted by capitalization. It is calculated by summing the prices of the constituent stocks and dividing them by a factor, currently 0.152. The index was founded by Charles Dow, who also founded the Wall Street Journal. In later years it has been criticized for not being broadly representative enough because it only tracks 30 conglomerates, unlike broader indices such as the S&P 500.
Many different factors drive the Dow Jones Industrial Average (DJIA). The aggregate performance of the component companies revealed in quarterly company earnings reports is the main one. US and global macroeconomic data also contributes as it impacts on investor sentiment. The level of interest rates, set by the Federal Reserve (Fed), also influences the DJIA as it affects the cost of credit, on which many corporations are heavily reliant. Therefore, inflation can be a major driver as well as other metrics which impact the Fed decisions.
Dow Theory is a method for identifying the primary trend of the stock market developed by Charles Dow. A key step is to compare the direction of the Dow Jones Industrial Average (DJIA) and the Dow Jones Transportation Average (DJTA) and only follow trends where both are moving in the same direction. Volume is a confirmatory criteria. The theory uses elements of peak and trough analysis. Dow’s theory posits three trend phases: accumulation, when smart money starts buying or selling; public participation, when the wider public joins in; and distribution, when the smart money exits.
There are a number of ways to trade the DJIA. One is to use ETFs which allow investors to trade the DJIA as a single security, rather than having to buy shares in all 30 constituent companies. A leading example is the SPDR Dow Jones Industrial Average ETF (DIA). DJIA futures contracts enable traders to speculate on the future value of the index and Options provide the right, but not the obligation, to buy or sell the index at a predetermined price in the future. Mutual funds enable investors to buy a share of a diversified portfolio of DJIA stocks thus providing exposure to the overall index.
Author

Joshua Gibson
FXStreet
Joshua joins the FXStreet team as an Economics and Finance double major from Vancouver Island University with twelve years' experience as an independent trader focusing on technical analysis.


