Dow Jones Industrial Average sheds a quarter of a percent on sluggish Monday
- The Dow Jones grappled with the low end to kick off the trading week.
- US PMI activity figures came in better than expected, but still in contraction territory.
- Markets are gearing up for another print of key NFP jobs figures this week.

The Dow Jones Industrial Average (DJIA) knocked lower on Monday, falling off-balance after US Purchasing Managers Index (PMI) figures came in better than anticipated but showed US business activities are still on the low side of expectations. The Dow Jones recovered into an off-kilter stance, grappling with the day’s opening bids, but the major equity index is still tilted toward the downside just south of the 45,000 handle.
US ISM Manufacturing PMI business activity survey results rose to a five-month high of 48.4 in November, rising from October’s print of 46.5 and beating the median market forecast of 47.5. Despite the upswing in indexed respondent expectations, ISM Manufacturing PMI figures have remained below the key 50.0 level since April, keeping investors leery about the strength of the broader US economy below the surface figures.
ISM Services PMI figures for November will print later in the week, and there is plenty of preview data in US employment figures before Friday’s Nonfarm Payrolls (NFP) print. JOLTS Job Openings for the month of October will print on Tuesday, with ADP Employment Change slated for Wednesday. Weekly Initial Jobless Claims will round out the labor preview prints on Thursday.
Dow Jones news
Despite an overall upbeat tone in equities on Monday, most of the Dow Jones index was stuck in red territory for the day. Two-thirds of the DJIA is set to end Monday lower than they started, with losses led by Amgen (AMGN), which fell 1.6%, backsliding to $278 per share. Declines in the banking sector also sent JPMorgan (JPM) lower, which eased 1.3% to fall below $250 per share.
Elsewhere on the Dow Jones, Amazon (AMZN) found extra room on the upside as Black Friday and Cyber Monday shoppers pile into the online retail platform.
Dow Jones price forecast
Bullish moment has drained out of daily candlesticks on the Dow Jones, with price action battling for a foothold just below 45,000. The major equity index tested the key major handle several times this week, but bidders have run out of gas in the near-term. Despite easing buying pressure, downside momentum remains incredibly limited, with sellers struggling to make headway back toward 44,500.
Some form of a pullback should be expected on the charts after the Dow Jones put in its best single-month performance of 2024 in November. The DJIA rose over 7.5% MoM, taking the Dow to nearly a 20% gain YTD.
Dow Jones daily chart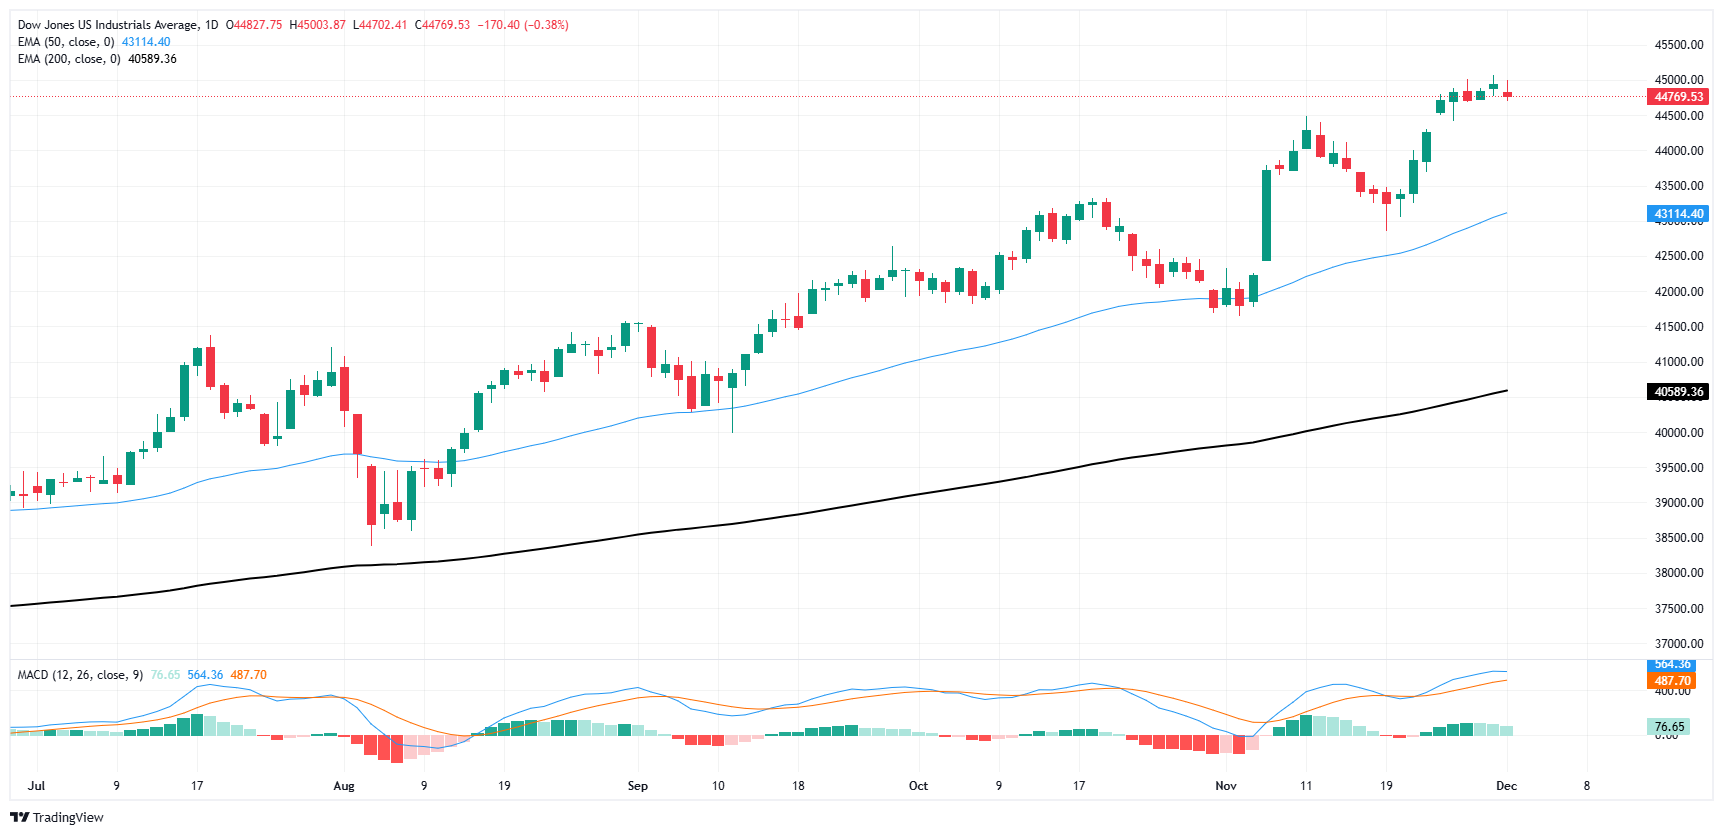
Dow Jones FAQs
The Dow Jones Industrial Average, one of the oldest stock market indices in the world, is compiled of the 30 most traded stocks in the US. The index is price-weighted rather than weighted by capitalization. It is calculated by summing the prices of the constituent stocks and dividing them by a factor, currently 0.152. The index was founded by Charles Dow, who also founded the Wall Street Journal. In later years it has been criticized for not being broadly representative enough because it only tracks 30 conglomerates, unlike broader indices such as the S&P 500.
Many different factors drive the Dow Jones Industrial Average (DJIA). The aggregate performance of the component companies revealed in quarterly company earnings reports is the main one. US and global macroeconomic data also contributes as it impacts on investor sentiment. The level of interest rates, set by the Federal Reserve (Fed), also influences the DJIA as it affects the cost of credit, on which many corporations are heavily reliant. Therefore, inflation can be a major driver as well as other metrics which impact the Fed decisions.
Dow Theory is a method for identifying the primary trend of the stock market developed by Charles Dow. A key step is to compare the direction of the Dow Jones Industrial Average (DJIA) and the Dow Jones Transportation Average (DJTA) and only follow trends where both are moving in the same direction. Volume is a confirmatory criteria. The theory uses elements of peak and trough analysis. Dow’s theory posits three trend phases: accumulation, when smart money starts buying or selling; public participation, when the wider public joins in; and distribution, when the smart money exits.
There are a number of ways to trade the DJIA. One is to use ETFs which allow investors to trade the DJIA as a single security, rather than having to buy shares in all 30 constituent companies. A leading example is the SPDR Dow Jones Industrial Average ETF (DIA). DJIA futures contracts enable traders to speculate on the future value of the index and Options provide the right, but not the obligation, to buy or sell the index at a predetermined price in the future. Mutual funds enable investors to buy a share of a diversified portfolio of DJIA stocks thus providing exposure to the overall index.
Author

Joshua Gibson
FXStreet
Joshua joins the FXStreet team as an Economics and Finance double major from Vancouver Island University with twelve years' experience as an independent trader focusing on technical analysis.


