Dow Jones Industrial Average taps fresh record peak after Fed trims interest rate 50 bps
- Dow Jones climbs into fresh record bid after Fed delivers 50 bps rate cut before settling back.
- FOMC dot plot shifts lower as policymakers absorb additional rate cut expectations.
- Fed head Powell's press conference keeps markets on-balance.

The Dow Jones Industrial Average (DJIA) soared into an all-time high just shy of 42,000 on Wednesday after the Federal Reserve (Fed) finally broke its wait-and-see stance, kicking open the doors on its first rate cut in over four years with a 50 bps trim to the Fed Funds rate.
What just happened: Why did the Federal Reserve cut interest rates?
The Fed's dot plot of the Federal Open Market Committee's (FOMC) Summary of Economic Projections was also revised downward from the central bank's previous rate outlook. The median policy expectations from the Fed now see the Fed Funds rate at 4.4% by year-end 2024 and 3.4% by year-end 2025, down from 5.1% and 4.1%, respectively.
Going deeper into the Fed's notes, Fed policymakers now see US Gross Domestic Product (GDP) growth of 2.0% flat through 2024, down from the previous print of 2.1% in June. Fed officials also expected the US Unemployment Rate to settle around 4.4% by the end of 2024.
Fed Chair Jerome Powell did his best to soothe markets during his ensuing press conference following the Fed's bumper 50 bps rate trim, highlighting that the Fed will resume its wait-and-see approach to incoming economic data in the weeks to come before deciding on further rate cuts. The Fed head's measured approach to explaining the Fed's policy adjustment helped to keep market flows on-balance, and rate markets are pricing in 65% chance of no further action at the FOMC's next rate call on November 7.
Dow Jones news
Despite an initial kick into a new all-time high, the Dow Jones is still trading on the tepid side on Wednesday, churning just south of the 41,700 mark post-Fed. A little over half of the Dow Jones' constituent securities hit the red for the day, with Intel (INTC) tumbling back an additional -3.25% to fall below $21 per share. Gains were led by Apple (AAPL), which rose 1.8% on the day and tested $221 per share.
Elsewhere, Honeywell (HON) is attempting to recover an off-kilter stance on Wednesday, rallying 1% after kicking the day off off-balance despite a recent announcement of a partnership with Samsung to produce carbon capture devices on a larger scale.
Dow Jones price forecast
The Dow Jones flubbed Wednesday's brief peak at record highs near 41,970, settling back and end the day near 41,500 and shedding 100 points, or one-quater of one percent, in the process. The major equity board is still holding on the high end of recent bullish momentum, but a lack of sustained bidding pressure could see the Dow Jones ease back toward the 50-day Exponential Moving Average (EMA) near 40,500.
Dow Jones daily chart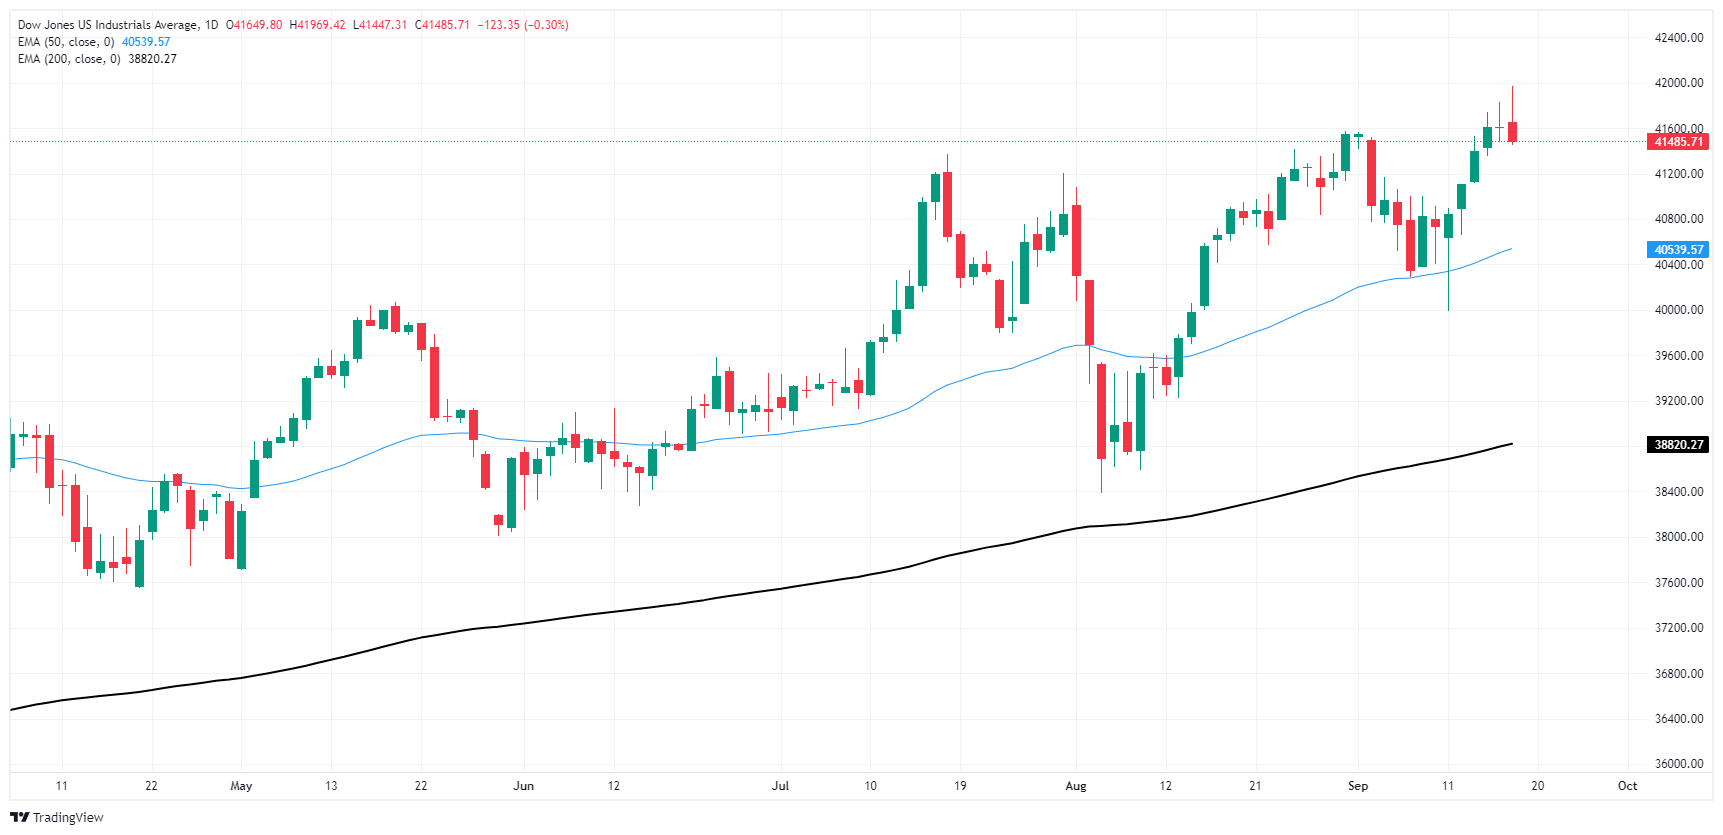
Dow Jones FAQs
The Dow Jones Industrial Average, one of the oldest stock market indices in the world, is compiled of the 30 most traded stocks in the US. The index is price-weighted rather than weighted by capitalization. It is calculated by summing the prices of the constituent stocks and dividing them by a factor, currently 0.152. The index was founded by Charles Dow, who also founded the Wall Street Journal. In later years it has been criticized for not being broadly representative enough because it only tracks 30 conglomerates, unlike broader indices such as the S&P 500.
Many different factors drive the Dow Jones Industrial Average (DJIA). The aggregate performance of the component companies revealed in quarterly company earnings reports is the main one. US and global macroeconomic data also contributes as it impacts on investor sentiment. The level of interest rates, set by the Federal Reserve (Fed), also influences the DJIA as it affects the cost of credit, on which many corporations are heavily reliant. Therefore, inflation can be a major driver as well as other metrics which impact the Fed decisions.
Dow Theory is a method for identifying the primary trend of the stock market developed by Charles Dow. A key step is to compare the direction of the Dow Jones Industrial Average (DJIA) and the Dow Jones Transportation Average (DJTA) and only follow trends where both are moving in the same direction. Volume is a confirmatory criteria. The theory uses elements of peak and trough analysis. Dow’s theory posits three trend phases: accumulation, when smart money starts buying or selling; public participation, when the wider public joins in; and distribution, when the smart money exits.
There are a number of ways to trade the DJIA. One is to use ETFs which allow investors to trade the DJIA as a single security, rather than having to buy shares in all 30 constituent companies. A leading example is the SPDR Dow Jones Industrial Average ETF (DIA). DJIA futures contracts enable traders to speculate on the future value of the index and Options provide the right, but not the obligation, to buy or sell the index at a predetermined price in the future. Mutual funds enable investors to buy a share of a diversified portfolio of DJIA stocks thus providing exposure to the overall index.
Fed FAQs
Monetary policy in the US is shaped by the Federal Reserve (Fed). The Fed has two mandates: to achieve price stability and foster full employment. Its primary tool to achieve these goals is by adjusting interest rates. When prices are rising too quickly and inflation is above the Fed’s 2% target, it raises interest rates, increasing borrowing costs throughout the economy. This results in a stronger US Dollar (USD) as it makes the US a more attractive place for international investors to park their money. When inflation falls below 2% or the Unemployment Rate is too high, the Fed may lower interest rates to encourage borrowing, which weighs on the Greenback.
The Federal Reserve (Fed) holds eight policy meetings a year, where the Federal Open Market Committee (FOMC) assesses economic conditions and makes monetary policy decisions. The FOMC is attended by twelve Fed officials – the seven members of the Board of Governors, the president of the Federal Reserve Bank of New York, and four of the remaining eleven regional Reserve Bank presidents, who serve one-year terms on a rotating basis.
In extreme situations, the Federal Reserve may resort to a policy named Quantitative Easing (QE). QE is the process by which the Fed substantially increases the flow of credit in a stuck financial system. It is a non-standard policy measure used during crises or when inflation is extremely low. It was the Fed’s weapon of choice during the Great Financial Crisis in 2008. It involves the Fed printing more Dollars and using them to buy high grade bonds from financial institutions. QE usually weakens the US Dollar.
Quantitative tightening (QT) is the reverse process of QE, whereby the Federal Reserve stops buying bonds from financial institutions and does not reinvest the principal from the bonds it holds maturing, to purchase new bonds. It is usually positive for the value of the US Dollar.
Author

Joshua Gibson
FXStreet
Joshua joins the FXStreet team as an Economics and Finance double major from Vancouver Island University with twelve years' experience as an independent trader focusing on technical analysis.

















