Crude Oil steady around a 3% intraday gain after OPEC delayed its output normalization to 2025
- Crude Oil has popped on Monday into the European session, surging above $71.00.
- The sharp move comes after OPEC+ has agreed to delay its 180,000 barrels production increase to December.
- The US Dollar Index is licking its wounds after Sunday polls show slight favor for Harris to win.

Crude Oil price is ticking higher by 3% on Monday on the back of an OPEC statement in which the Oil cartel says it has agreed to delay its foreseen production restart until at least December. Previously, the group was set to add 180,000 barrels a day from October but after the announcement, this won’t happen before the end of December, limiting supply excesses for the last few months of 2024.
The US Dollar Index (DXY), which tracks the performance of the Greenback against six other currencies, is dipping on Monday. The main driver is the US presidential election after polls from ABC News/Ipsos showed Vice President Kamala Harris leading by a 49%-46% gap nationally while The New York Times/Siena survey showed Harris ahead in five of the seven swing states.
At the time of writing, Crude Oil (WTI) trades at $71.16 and Brent Crude at $74.87
Oil news and market movers: OPEC+ move already questioned
- OPEC+ has pushed back its December production increase by one month, the second delay to its plans to revive supply as prices continue to struggle amid a fragile economic outlook, Bloomberg reports.
- Most major stock markets in the Gulf region fell in early trade on Monday, following a decision by OPEC+ to delay a planned December oil output increase by one month, Reuters reports.
- Iran has vowed to retaliate against Israel “in full and by all means necessary” after tensions in the region remain simmering, Reuters reports.
Oil Technical Analysis: What is a month?
Crude Oil prices are rallying after OPEC+ has published a brief statement on its website on Sunday saying that it will delay its Oil output increase again by a month. Although that might look like a sound thing to do, it still remains a drop on a hot plate. Whether it will be enough to bring back Oil markets in a well-balanced position between supply and demand remains to be seen.
On the upside, the 55-day Simple Moving Average (SMA) at $70.92 remains the first level to reclaim and needs to see a daily close. Next up, the hefty technical level at $74.45, with the 100-day Simple Moving Average (SMA) and a few pivotal lines, is possibly the next big hurdle ahead. The 200-day SMA at $76.88 is still quite far off, although it could get tested in case tensions in the Middle East pick up again.
On the downside, traders need to look much lower at $67.12, a level that supported the price in May and June 2023. In case that level breaks, the 2024 year-to-date low emerges at $64.75 followed by $64.38, the low from 2023.
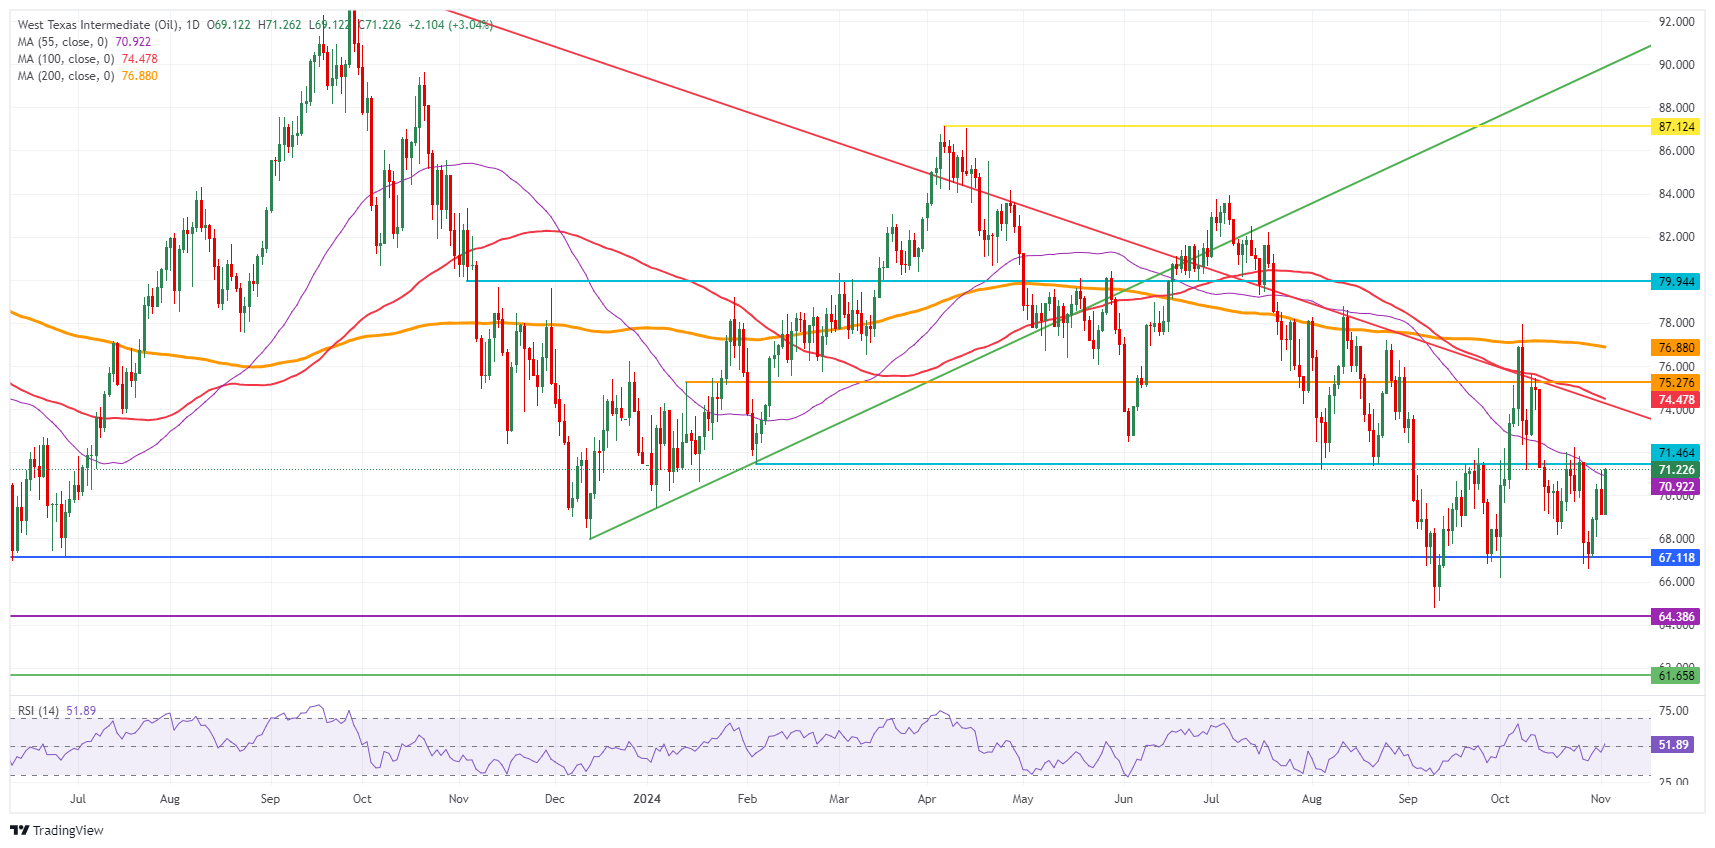
US WTI Crude Oil: Daily Chart
WTI Oil FAQs
WTI Oil is a type of Crude Oil sold on international markets. The WTI stands for West Texas Intermediate, one of three major types including Brent and Dubai Crude. WTI is also referred to as “light” and “sweet” because of its relatively low gravity and sulfur content respectively. It is considered a high quality Oil that is easily refined. It is sourced in the United States and distributed via the Cushing hub, which is considered “The Pipeline Crossroads of the World”. It is a benchmark for the Oil market and WTI price is frequently quoted in the media.
Like all assets, supply and demand are the key drivers of WTI Oil price. As such, global growth can be a driver of increased demand and vice versa for weak global growth. Political instability, wars, and sanctions can disrupt supply and impact prices. The decisions of OPEC, a group of major Oil-producing countries, is another key driver of price. The value of the US Dollar influences the price of WTI Crude Oil, since Oil is predominantly traded in US Dollars, thus a weaker US Dollar can make Oil more affordable and vice versa.
The weekly Oil inventory reports published by the American Petroleum Institute (API) and the Energy Information Agency (EIA) impact the price of WTI Oil. Changes in inventories reflect fluctuating supply and demand. If the data shows a drop in inventories it can indicate increased demand, pushing up Oil price. Higher inventories can reflect increased supply, pushing down prices. API’s report is published every Tuesday and EIA’s the day after. Their results are usually similar, falling within 1% of each other 75% of the time. The EIA data is considered more reliable, since it is a government agency.
OPEC (Organization of the Petroleum Exporting Countries) is a group of 12 Oil-producing nations who collectively decide production quotas for member countries at twice-yearly meetings. Their decisions often impact WTI Oil prices. When OPEC decides to lower quotas, it can tighten supply, pushing up Oil prices. When OPEC increases production, it has the opposite effect. OPEC+ refers to an expanded group that includes ten extra non-OPEC members, the most notable of which is Russia.
Author

Filip Lagaart
FXStreet
Filip Lagaart is a former sales/trader with over 15 years of financial markets expertise under its belt.


