Crude Oil lurches higher amid US inventory draws, fresh Middle East tensions
- WTI rallied into $78.00 per barrel on Wednesday.
- EIA reported another drawdown in US Crude Oil inventories.
- Markets further bolstered by a potential Fed rate cut in September.

West Texas Intermediate (WTI) US Crude Oil jumped back into $78.00 per barrel on Wednesday after the Energy Information Administration (EIA) reported another steeper-than-expected decline in US Crude Oil Stocks Change, adding to a recent downswing in US barrel counts. The Federal Reserve (Fed) held rates steady as markets broadly expected, with a path forward for a September rate cut, helping to bolster commodity risk sentiment.
According to the EIA, US Curde Oil Stocks Change for the week ended July 26 contracted another -3.436 million barrels, far below the forecast -1.6 million barrel decline and piling onto the previous week’s -3.471 million contraction in US Crude Oil supplies. The EIA noted that US Crude Oil output fell in May for the first time since January, but also highlighted that US supplied products of fossil fuel and petroleum products hit its highest levels since August of 2023.
The Fed stood pat on interest rates for the July rate call as markets had broadly forecast, and cautiously-optimistic statements from Fed Chairman Jerome Powell helped keep broad-market risk appetite bid into the high side after the Fed head laid out the blueprint for what the Fed would like to see in key data prints ahead of the September 18 rate call. The Fed is hoping for one last round of inflation data to confirm that price growth is headed for the 2% annual target, and continued easing in US labor figures.
Elsewhere, Crude Oil risk aversion took a step higher on Wednesday following confirmation that the leader of Iranian Hezbollah’s air force was assassinated this week. According to unconfirmed reports, Iranian officials are calling for military action against Israel in retaliation, a move that would see Iran step fully into the Israel-Palestine conflict. An escalation of involvement in the Gaza conflict would see shockwaves through global Crude Oil markets.
WTI technical outlook
WTI US Crude Oil recovered significant ground on Wednesday, rallying 5% from Tuesday’s eight-week low of $74.24. In a steep, one-sided recovery rally, WTI topped $78.00.
US Crude Oil remains notably on the soft side despite Wednesday’s recovery bid, trading on the low end of the 200-day Exponential Moving Average (EMA) just above $79.00, and price action is swamped out on the bearish side of a downside run that saw WTI close in the red for all but four of the last 18 consecutive trading days.
WTI hourly chart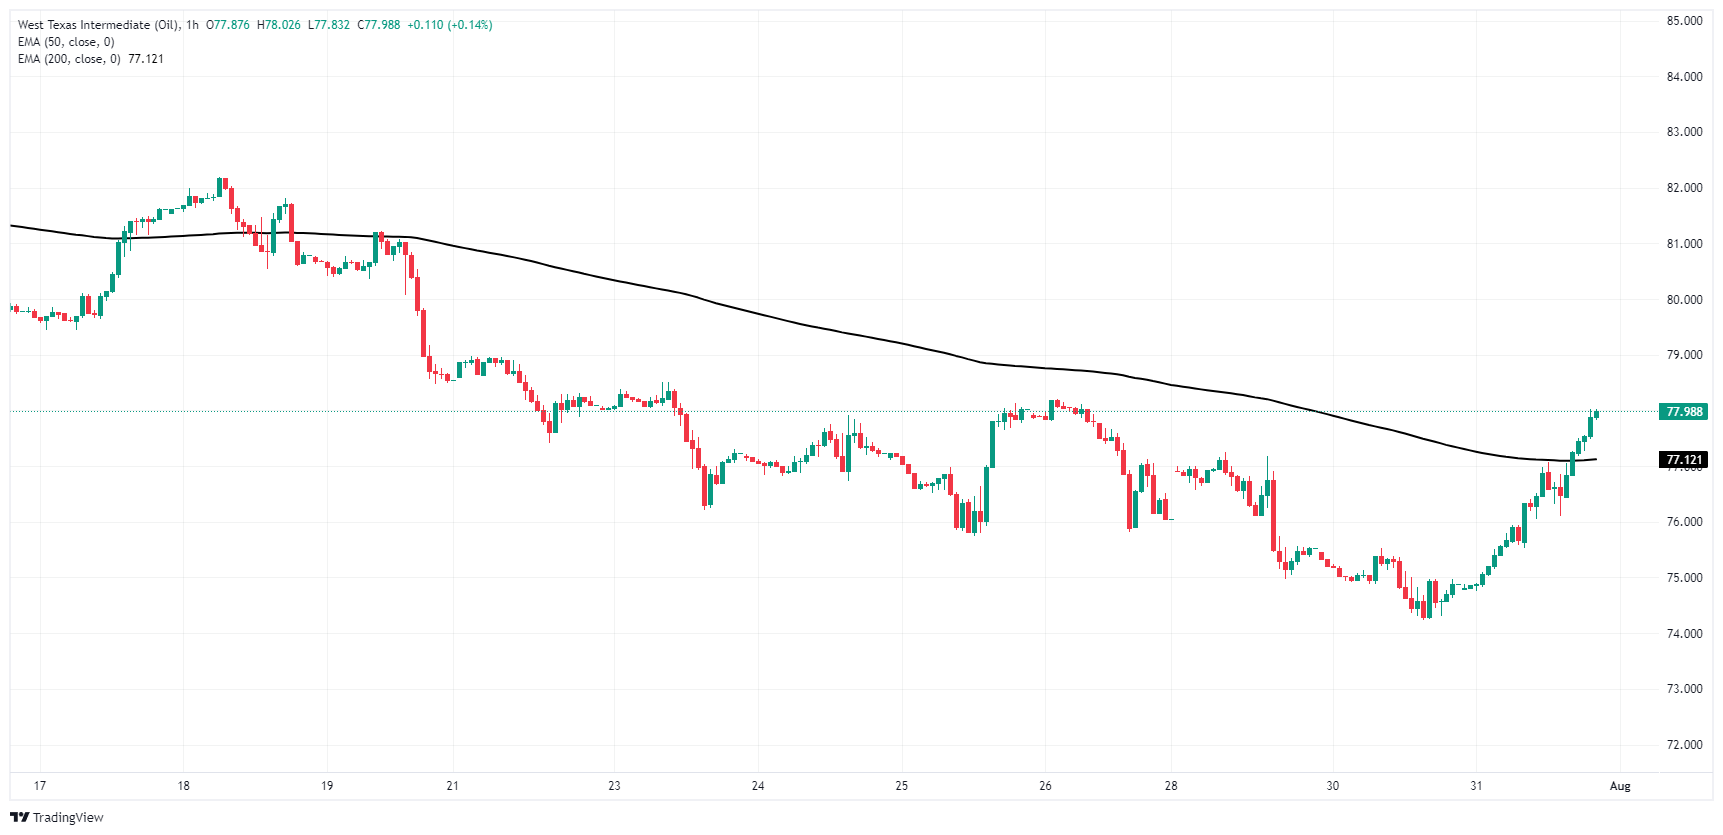
WTI daily chart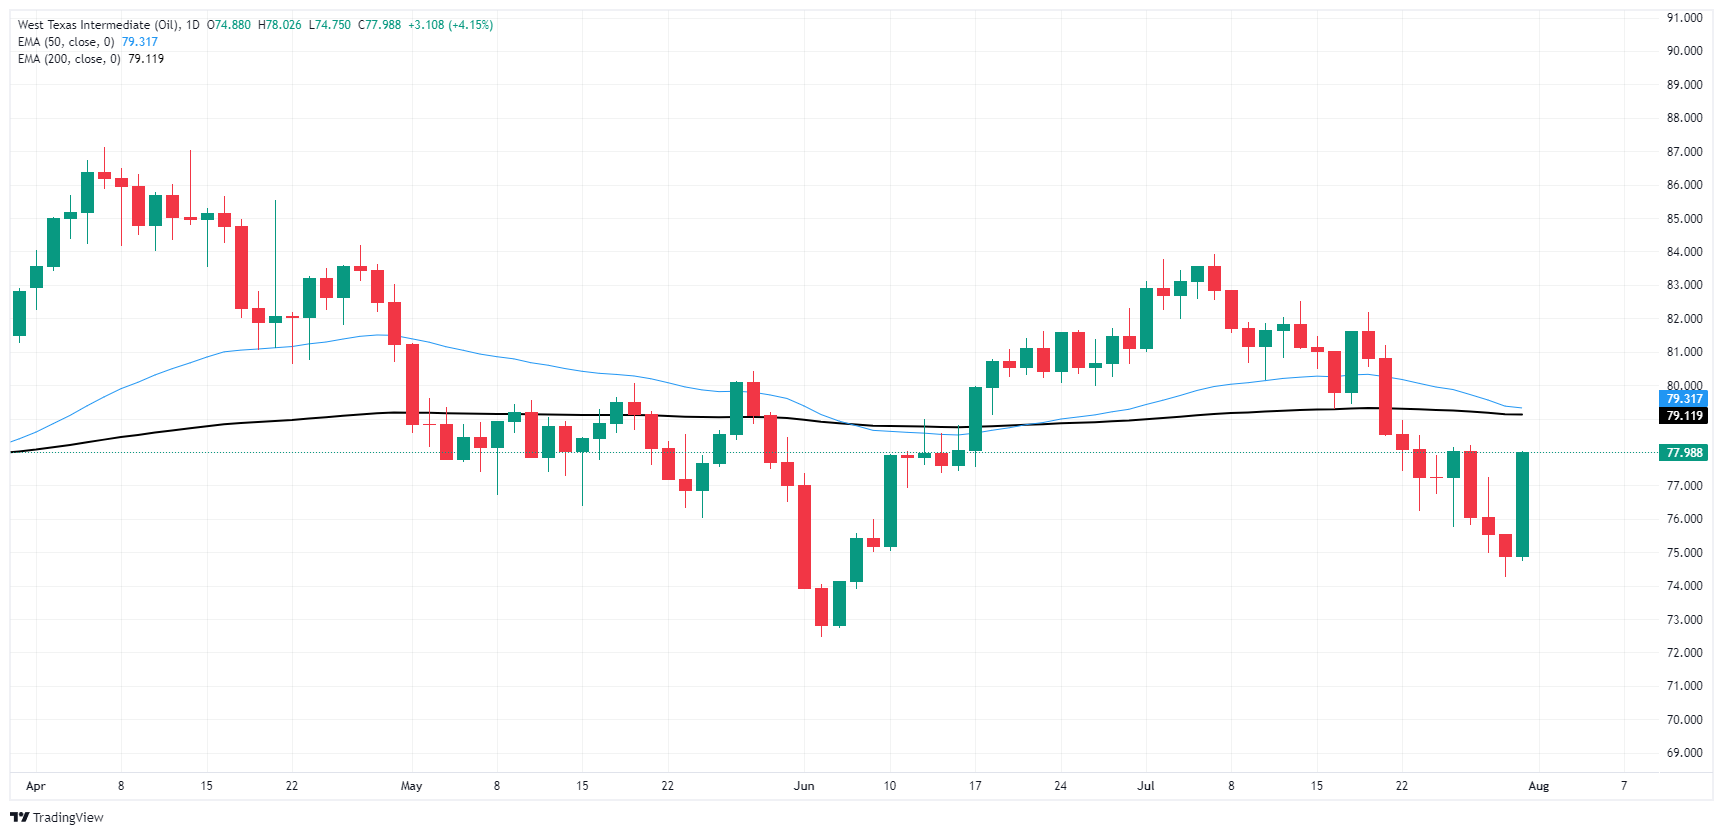
WTI Oil FAQs
WTI Oil is a type of Crude Oil sold on international markets. The WTI stands for West Texas Intermediate, one of three major types including Brent and Dubai Crude. WTI is also referred to as “light” and “sweet” because of its relatively low gravity and sulfur content respectively. It is considered a high quality Oil that is easily refined. It is sourced in the United States and distributed via the Cushing hub, which is considered “The Pipeline Crossroads of the World”. It is a benchmark for the Oil market and WTI price is frequently quoted in the media.
Like all assets, supply and demand are the key drivers of WTI Oil price. As such, global growth can be a driver of increased demand and vice versa for weak global growth. Political instability, wars, and sanctions can disrupt supply and impact prices. The decisions of OPEC, a group of major Oil-producing countries, is another key driver of price. The value of the US Dollar influences the price of WTI Crude Oil, since Oil is predominantly traded in US Dollars, thus a weaker US Dollar can make Oil more affordable and vice versa.
The weekly Oil inventory reports published by the American Petroleum Institute (API) and the Energy Information Agency (EIA) impact the price of WTI Oil. Changes in inventories reflect fluctuating supply and demand. If the data shows a drop in inventories it can indicate increased demand, pushing up Oil price. Higher inventories can reflect increased supply, pushing down prices. API’s report is published every Tuesday and EIA’s the day after. Their results are usually similar, falling within 1% of each other 75% of the time. The EIA data is considered more reliable, since it is a government agency.
OPEC (Organization of the Petroleum Exporting Countries) is a group of 13 Oil-producing nations who collectively decide production quotas for member countries at twice-yearly meetings. Their decisions often impact WTI Oil prices. When OPEC decides to lower quotas, it can tighten supply, pushing up Oil prices. When OPEC increases production, it has the opposite effect. OPEC+ refers to an expanded group that includes ten extra non-OPEC members, the most notable of which is Russia.
Author

Joshua Gibson
FXStreet
Joshua joins the FXStreet team as an Economics and Finance double major from Vancouver Island University with twelve years' experience as an independent trader focusing on technical analysis.


