Crude Oil attempts to pop above $70.00 with US session turning positive
- Crude Oil jumps higher and turns green on the day.
- Oil starts to price in a large Fed rate cut and tropical storm Francine wiping out 3.6m barrels of output.
- The US Dollar Index remains trading at the lower boundary of September’s bandwidth.

Crude Oil has a change of heart at the start of the US trading session this Tuesay and turns green. Traders are starting embrace the bullish elements on the table for this week. The first element is the numbers from tropical storm Francine’s passage in the Gulf region as the evacuation of the area will account for nearly 3.6 million barrels less in oil output for last week.
Another driver that should support prices is the growing expectations that the US Federal Reserve (Fed) will opt for a large 50-basis-points interest-rate cut on Wednesday. This helps Crude Oil prices higher in the assumption that a bigger rate cut would give a brief push to the economic activity, which in turn would benefit Oil demand.
At the time of writing, Crude Oil (WTI) trades at $69.78 and Brent Crude at $72.93.
Oil news and market movers: US supply squeezed
- Bloomberg reports that there is some fallout in the Chinese slowdown in activity: two oil refiners in China were declared bankrupt.
- More than 12% of crude output in the US Gulf and 16% of Natural Gas output remain offline after tropical storm Francine hit the area, MT Newswires reports. Bloomberg reports that Francine has wiped out roughly 3.6 million barrels of Oil output last week, with lingering disruptions still in play for this week.
- The restart of a key Iraqi Oil pipeline which was already closed for over a year is facing more delays with disagreements over costs, the nation’s prime minister Mohammed Shia AL-Sudani said. In this case, bad news is good news, as the pipeline outage is helping Iraq to uphold its OPEC production quota, Reuters reports.
- At 20:30 GMT, the weekly stockpile numbers will come out from the American Petroleum Institute for the week ending September 13. Analysts expect a small decline of 100,000 barrels, much less than the drawdown of 2.79 million barrels seen a week earlier.
Oil Technical Analysis: Just a sigh away from $70.00
Crude Oil price could be catching a bid with recent data about tropical storm Francine providing some short-term tailwinds for the commodity. The question, however, is how much further the reprieve can go. With $70.00 in reach, at least one attempt to pop above the big figure level should be possible.
As already mentioned, the first level to watch on the upside remains $70.00. Once there has been a daily close above it, $71.46 gets back on the table as the next level to look out for. Ultimately, a return to $75.27 is still possible, but would likely come after a seismic shift in current balances.
Support should be very close by at $68.19, which was the triple bottom back in the summer of 2023. The next level further down the line is $64.38, the low from March and May 2023. Should that level face a second test and snap, $61.65 becomes a target, with of course $60.00 as a psychologically big figure just below it, at least tempting to be tested.
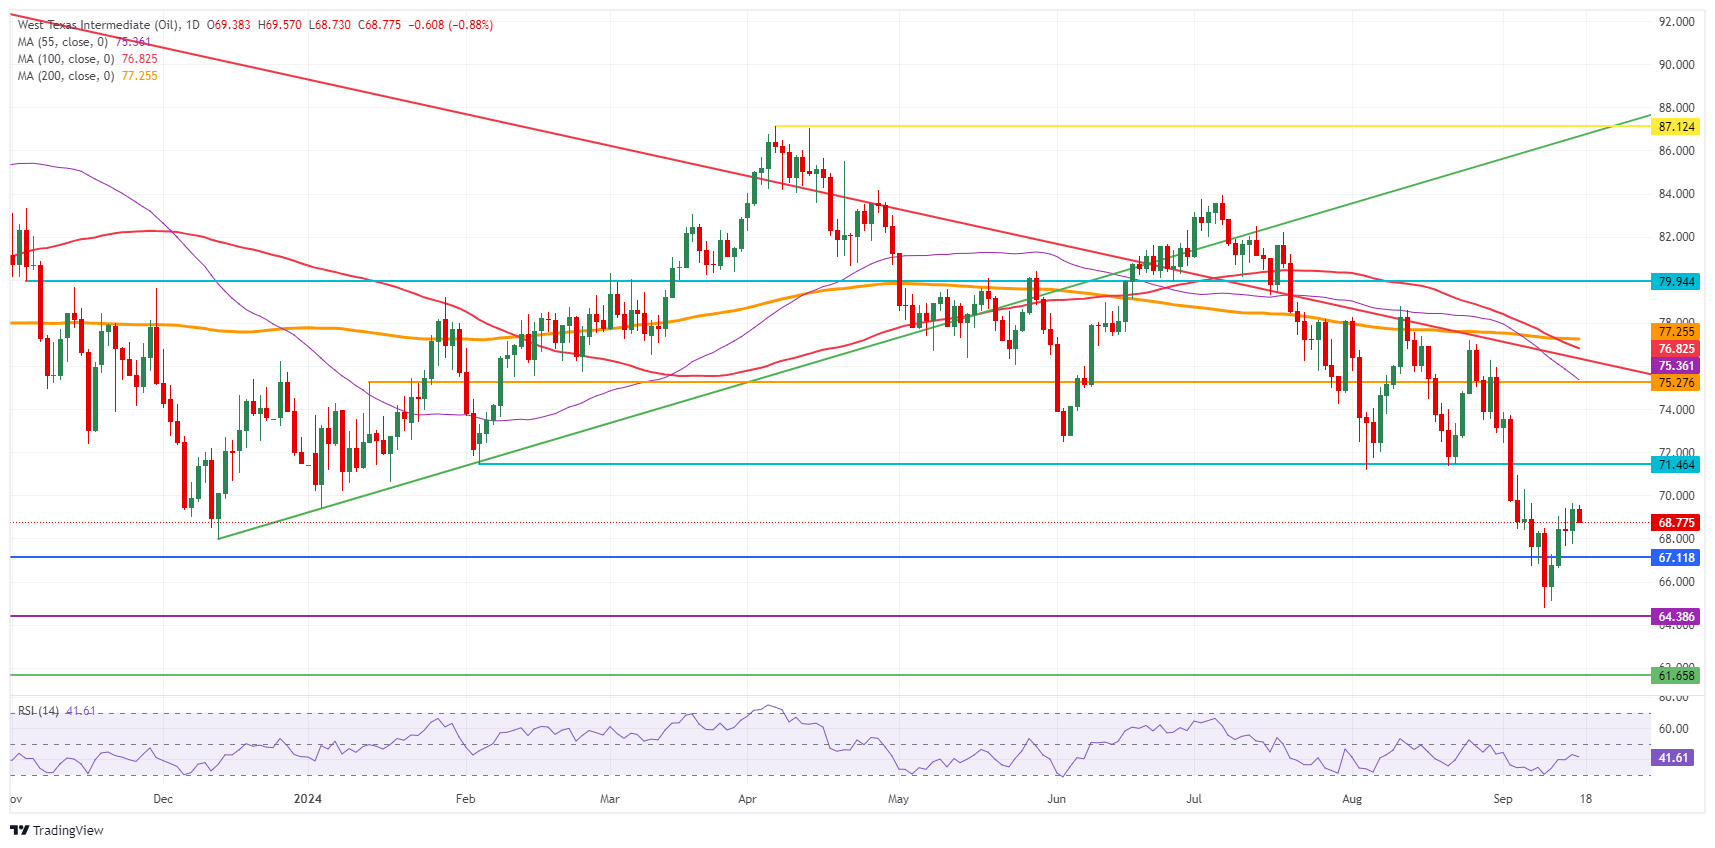
US WTI Crude Oil: Daily Chart
WTI Oil FAQs
WTI Oil is a type of Crude Oil sold on international markets. The WTI stands for West Texas Intermediate, one of three major types including Brent and Dubai Crude. WTI is also referred to as “light” and “sweet” because of its relatively low gravity and sulfur content respectively. It is considered a high quality Oil that is easily refined. It is sourced in the United States and distributed via the Cushing hub, which is considered “The Pipeline Crossroads of the World”. It is a benchmark for the Oil market and WTI price is frequently quoted in the media.
Like all assets, supply and demand are the key drivers of WTI Oil price. As such, global growth can be a driver of increased demand and vice versa for weak global growth. Political instability, wars, and sanctions can disrupt supply and impact prices. The decisions of OPEC, a group of major Oil-producing countries, is another key driver of price. The value of the US Dollar influences the price of WTI Crude Oil, since Oil is predominantly traded in US Dollars, thus a weaker US Dollar can make Oil more affordable and vice versa.
The weekly Oil inventory reports published by the American Petroleum Institute (API) and the Energy Information Agency (EIA) impact the price of WTI Oil. Changes in inventories reflect fluctuating supply and demand. If the data shows a drop in inventories it can indicate increased demand, pushing up Oil price. Higher inventories can reflect increased supply, pushing down prices. API’s report is published every Tuesday and EIA’s the day after. Their results are usually similar, falling within 1% of each other 75% of the time. The EIA data is considered more reliable, since it is a government agency.
OPEC (Organization of the Petroleum Exporting Countries) is a group of 13 Oil-producing nations who collectively decide production quotas for member countries at twice-yearly meetings. Their decisions often impact WTI Oil prices. When OPEC decides to lower quotas, it can tighten supply, pushing up Oil prices. When OPEC increases production, it has the opposite effect. OPEC+ refers to an expanded group that includes ten extra non-OPEC members, the most notable of which is Russia.
Author

Filip Lagaart
FXStreet
Filip Lagaart is a former sales/trader with over 15 years of financial markets expertise under its belt.

















