Crude Oil pops with US session pushing prices higher
- Crude Oil tests $72.00 for a break to the upside, after increasing more than 3% on Monday.
- Tropical storm Rafael to hit a production-sensitive regionin in coming days, could reduce US output by around 1.7 million barrels per day.
- The US Dollar Index is steady to sideways while the US is heading into election day to choose its next president.

Crude Oil price edges higher for a second consecutive day while US markets gear up for the US presidential elections. Lower supply could also be on the cards due to chances of disruption in the US Gulf region as tropical storm Rafael is making its way to the oil rigs and could take out 1.7 million barrels per day from production. Meanwhile, Saudi Aramco – the biggest state-owned oil producing company from Saudi Arabia – has posted a 15% drop in quarterly profit, adding to chances that Saudi Arabia urges OPEC+ to do more in limiting supply.
The US Dollar Index (DXY), which tracks the performance of the Greenback against six other currencies, is trading sideways as US citizens are heading to the voting booths to choose their next president. Chances that by Wednesday markets will know if Vice President Kamala Harris or former President Donald Trump will be the next president are very slim. Over 100 court cases and litigation efforts could kick in in case there is no clear- winner, a scenario that could throw the US into weeks or months of political uncertainty.
At the time of writing, Crude Oil (WTI) trades at $71.80 and Brent Crude at $75.50.
Oil news and market movers: Gulf region set to be hit for a third time this season
- Tropical Storm Rafael is on a path that could intersect in the next five days with BP, Shell, Occidental, and Chevron rigs in the US Gulf region, based on data from the Bureau of Ocean Energy Management and the National Hurricane Center, Bloomberg calculates. Roughly 1.7 million barrels per day would be taken out of production.
- Energy giant Saudi Aramco reported a 15% year-on-year drop in third-quarter profit on Tuesday, citing low Oil prices. The fall in net income to $27.56 billion this year from $32.58 billion in 2023 "was mainly due to the impact of lower crude oil prices and weakening refining margins", the firm said in a statement posted to the Saudi stock exchange, Bloomberg reports.
- The Kashagan field in Kazaskhstan reached full Oil production capacity on Sunday after repairs that lasted from October 7 to 28. The news was confirmed by the Ministry of Energy of the Republic and reported to Interfax. With the reopening, the overall Oil production for the republic has been revised to 88 million tons against the 90.5 million tons for 2024 previously estimated.
- At 21:30 GMT, the American Petroleum Institute (API) will release the weekly stockpile change numbers for this week. Expectations are for a build of 1.8 million barrels against the draw of 0.573 million barrels last week.
Oil Technical Analysis: Aramco telling sign of too low Oil price
Crude Oil prices could rally further now that Saudi Arabia is being hit where it hurts: earnings and income. With the 15% decline in quarterly earnings, alarm bells must be going off at the ministry of Energy in the oil state. Saudi Arabia could use its influence in OPEC+ to jack up Oil prices by limiting production in order to recoup incurred losses due to the lower Oil prices.
On the upside, the hefty technical level at $74.40, with the 100-day Simple Moving Average (SMA) and a few pivotal lines, is the next big hurdle ahead. The 200-day SMA at $76.85 is still quite far off, although it could get tested in case tensions in the Middle East pick up again.
Very near, though possibly even more important, is the 55-day SMA at $70.90, which should be able to resist any selling pressure. For more downside, traders need to look much lower at $67.12, a level that supported the price in May and June 2023. In case that level breaks, the 2024 year-to-date low emerges at $64.75 followed by $64.38, the low from 2023.
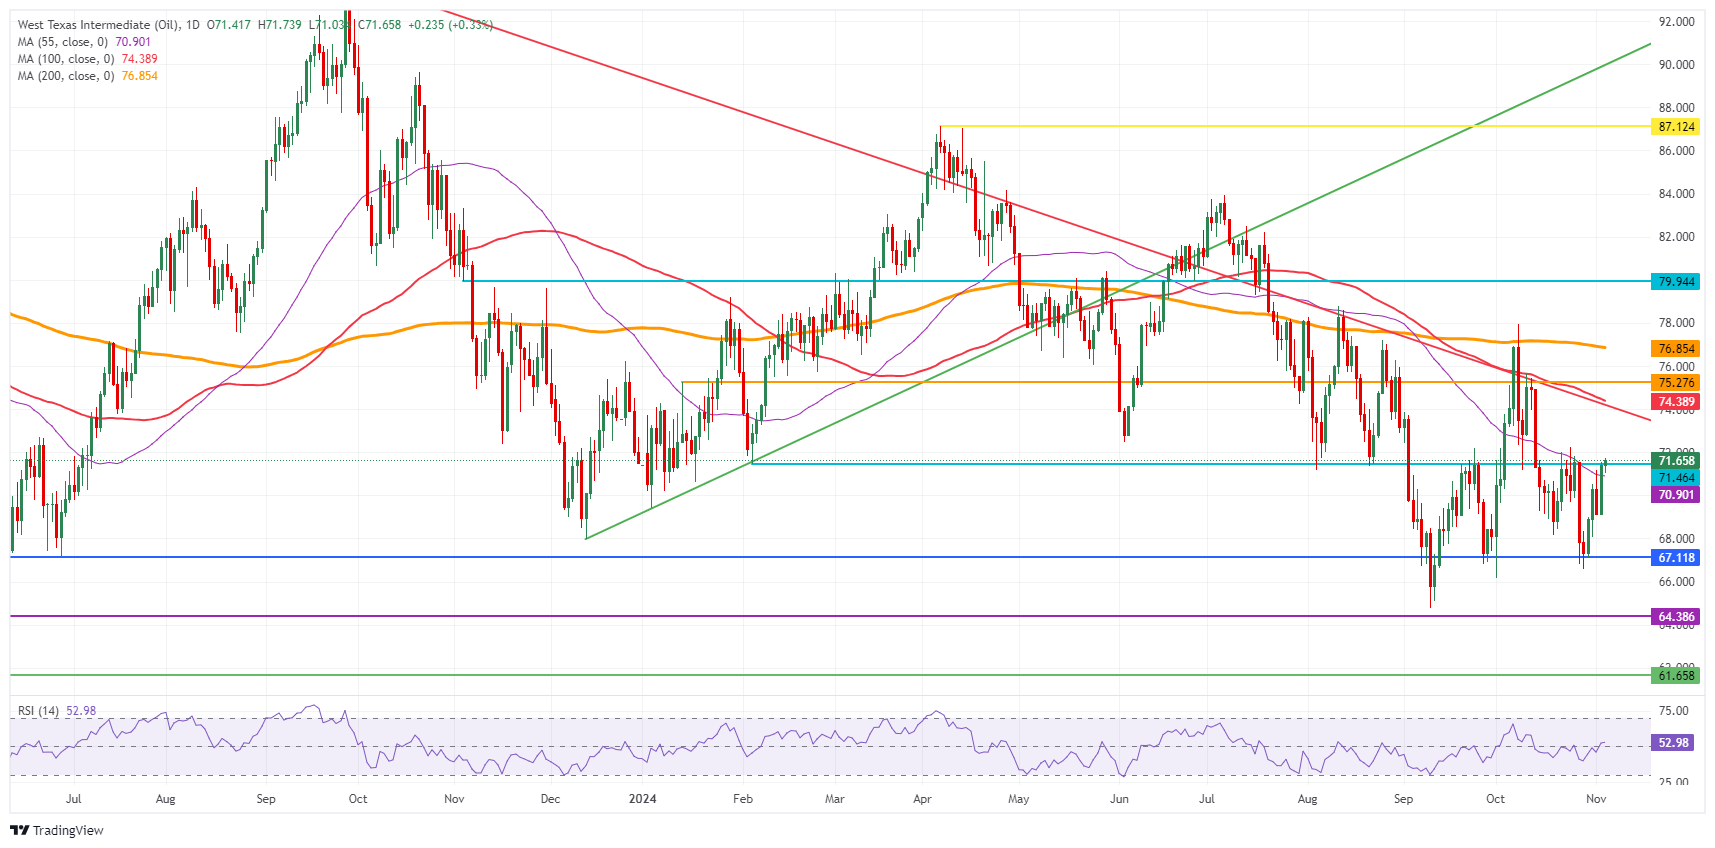
US WTI Crude Oil: Daily Chart
WTI Oil FAQs
WTI Oil is a type of Crude Oil sold on international markets. The WTI stands for West Texas Intermediate, one of three major types including Brent and Dubai Crude. WTI is also referred to as “light” and “sweet” because of its relatively low gravity and sulfur content respectively. It is considered a high quality Oil that is easily refined. It is sourced in the United States and distributed via the Cushing hub, which is considered “The Pipeline Crossroads of the World”. It is a benchmark for the Oil market and WTI price is frequently quoted in the media.
Like all assets, supply and demand are the key drivers of WTI Oil price. As such, global growth can be a driver of increased demand and vice versa for weak global growth. Political instability, wars, and sanctions can disrupt supply and impact prices. The decisions of OPEC, a group of major Oil-producing countries, is another key driver of price. The value of the US Dollar influences the price of WTI Crude Oil, since Oil is predominantly traded in US Dollars, thus a weaker US Dollar can make Oil more affordable and vice versa.
The weekly Oil inventory reports published by the American Petroleum Institute (API) and the Energy Information Agency (EIA) impact the price of WTI Oil. Changes in inventories reflect fluctuating supply and demand. If the data shows a drop in inventories it can indicate increased demand, pushing up Oil price. Higher inventories can reflect increased supply, pushing down prices. API’s report is published every Tuesday and EIA’s the day after. Their results are usually similar, falling within 1% of each other 75% of the time. The EIA data is considered more reliable, since it is a government agency.
OPEC (Organization of the Petroleum Exporting Countries) is a group of 12 Oil-producing nations who collectively decide production quotas for member countries at twice-yearly meetings. Their decisions often impact WTI Oil prices. When OPEC decides to lower quotas, it can tighten supply, pushing up Oil prices. When OPEC increases production, it has the opposite effect. OPEC+ refers to an expanded group that includes ten extra non-OPEC members, the most notable of which is Russia.
Author

Filip Lagaart
FXStreet
Filip Lagaart is a former sales/trader with over 15 years of financial markets expertise under its belt.















