Crude Oil on the backfoot after OPEC delivers statement confirming March delay
- Oil prices slips after OPEC+ officially confirms the more bearish option of a three-month delay.
- OPEC+ assumes President-elect Donald Trump will issue more Oil sanctions on Iran and Venezuela as key reason for its brief delay.
- The US Dollar Index turns softer after US Challenger Job Cuts turns higher month over month.

Crude Oil is turning red after OPEC+ delivers a written statement, confirming that a three-month delay on its production normalization. The decision comes with OPEC+ taking into account that President-elect will issue more and bigger Oil sanctions on Iran and Venezuela once taking office in January. That would, according to OPEC+, create a bottleneck effect of which it can benefit to normalize its production output as op April 2025.
The US Dollar Index (DXY) – which measures the performance of the US Dollar (USD) against a basket of currencies – is softening in very calm markets as the dust settles on the French political uncertainty after its government fell on Wednesday. Traders are sitting on their hands ahead of Friday’s Nonfarm Payrolls release, the last one of the year. Overnight, Fed Chairman Jerome Powell kept his cards close to his chest on the odds for a December rate cut, while commenting that the US debt is becoming unsustainable and needs to be addressed.
At the time of writing, Crude Oil (WTI) trades at $68.25 and Brent Crude at $72.10
Oil news and market movers: OPEC+ just lost controle over the Oil price
- More headlines throughout this Thursday, with Reuters citing sources and delegates that an agreement in principal is there for a delay. The timing is still under discussion.
- Around 12:15 GMT, several media outlets are referring to sources that OPEC+ has agreed to delay its output normalization by three months and restart its offline production as of April 2025.
- The overnight Crude stockpile change numbers from the Energy Information Administration (EIA) were completely different from the numbers seen earlier this week from the American Petroleum Institute (API). Whereas the API saw a surprise build of 1.232 million barrels, the EIA number came in as a surprise drawdown of 5.073 million barrels.
- OPEC+ is likely to extend their oil output cuts – originally scheduled to start in January – by at least three months, Reuters said in a Thursday report, citing OPEC+ sources.
Oil Technical Analysis: Failed attempt
Crude Oil price is now facing an even more uphill battle after OPEC+ cofirmed it will delay its production normalization process by three months until April 2025. That is taking the most bearish way out, in line with market expectations and not offering much tailwind for upside in Crude Oil prices. One might even say, for OPEC+ to have the audacity to think that President-elect Donald Trump would do their dirty work for them by issuing bigger Oil embargoes against Iran and Venezuela, might be reason enough for OPEC+ to be punished with more downside in Oil prices.
With the leg lower this week, the 55-day Simple Moving Average (SMA) at $70.17 triggered a firm rejection on Wednesday.A spike higher looks near impossible after recent comments, but traders must look out for $71.46 with the 100-day SMA at $71.65 as thick resistance. In case Oil traders can plough through that level, $75.27 is up next on the topside as pivotal level.
On the other side, traders see $67.12 – a level that held the price in May and June 2023 – rapidly nearing. In case that breaks, the 2024 year-to-date low emerges at $64.75, followed by $64.38, the low from 2023 will quickly be tested for more downside.
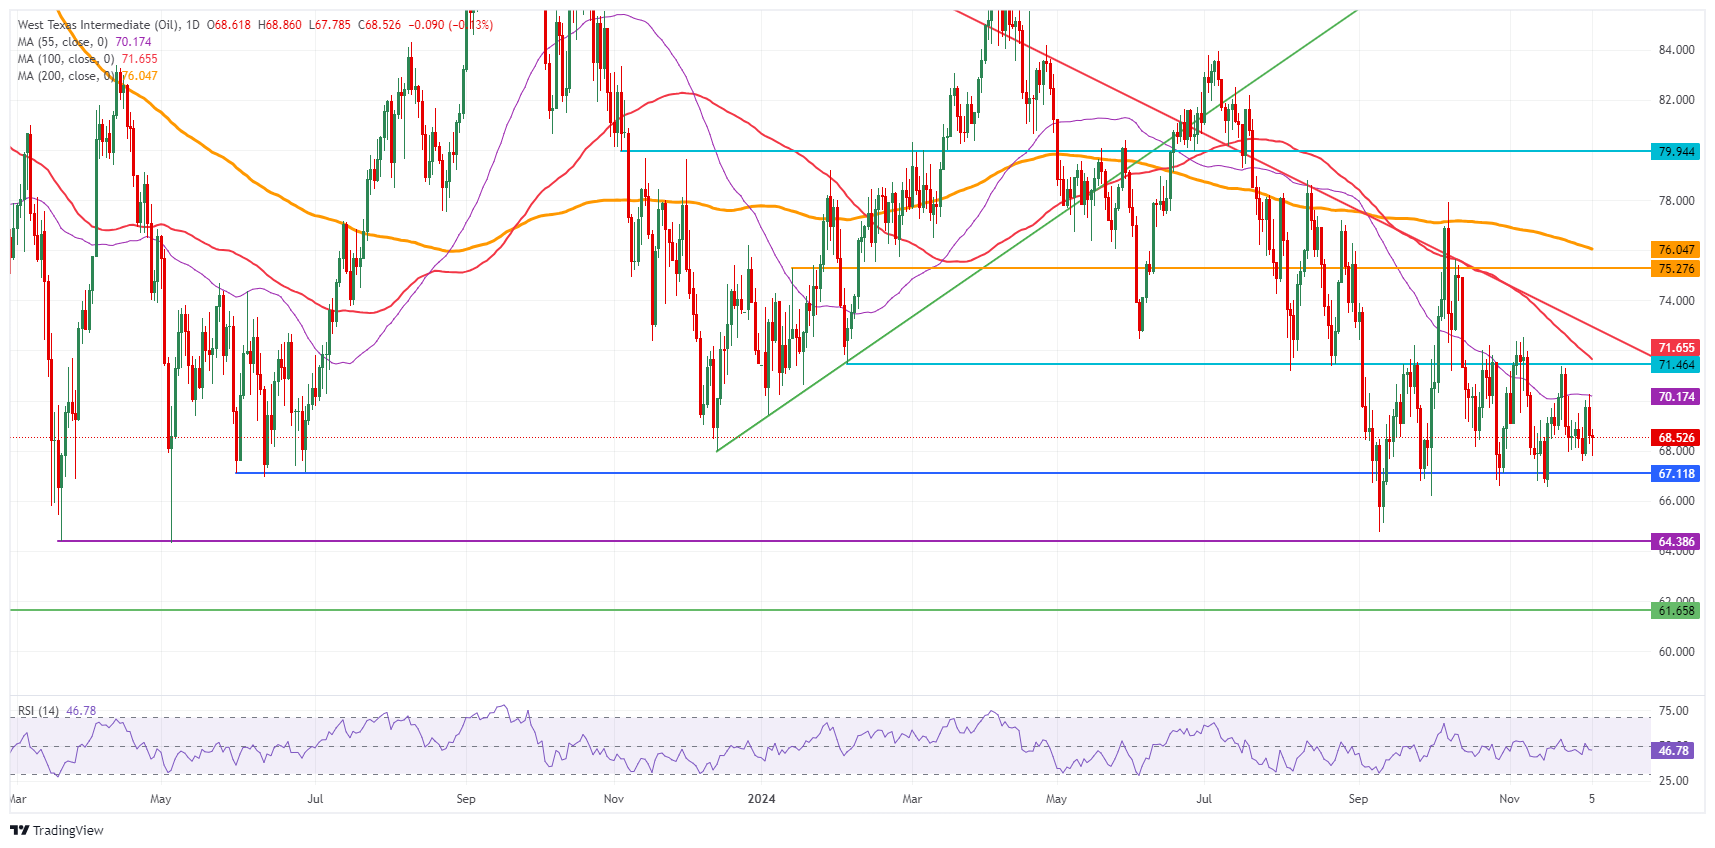
US WTI Crude Oil: Daily Chart
WTI Oil FAQs
WTI Oil is a type of Crude Oil sold on international markets. The WTI stands for West Texas Intermediate, one of three major types including Brent and Dubai Crude. WTI is also referred to as “light” and “sweet” because of its relatively low gravity and sulfur content respectively. It is considered a high quality Oil that is easily refined. It is sourced in the United States and distributed via the Cushing hub, which is considered “The Pipeline Crossroads of the World”. It is a benchmark for the Oil market and WTI price is frequently quoted in the media.
Like all assets, supply and demand are the key drivers of WTI Oil price. As such, global growth can be a driver of increased demand and vice versa for weak global growth. Political instability, wars, and sanctions can disrupt supply and impact prices. The decisions of OPEC, a group of major Oil-producing countries, is another key driver of price. The value of the US Dollar influences the price of WTI Crude Oil, since Oil is predominantly traded in US Dollars, thus a weaker US Dollar can make Oil more affordable and vice versa.
The weekly Oil inventory reports published by the American Petroleum Institute (API) and the Energy Information Agency (EIA) impact the price of WTI Oil. Changes in inventories reflect fluctuating supply and demand. If the data shows a drop in inventories it can indicate increased demand, pushing up Oil price. Higher inventories can reflect increased supply, pushing down prices. API’s report is published every Tuesday and EIA’s the day after. Their results are usually similar, falling within 1% of each other 75% of the time. The EIA data is considered more reliable, since it is a government agency.
OPEC (Organization of the Petroleum Exporting Countries) is a group of 12 Oil-producing nations who collectively decide production quotas for member countries at twice-yearly meetings. Their decisions often impact WTI Oil prices. When OPEC decides to lower quotas, it can tighten supply, pushing up Oil prices. When OPEC increases production, it has the opposite effect. OPEC+ refers to an expanded group that includes ten extra non-OPEC members, the most notable of which is Russia.
Author

Filip Lagaart
FXStreet
Filip Lagaart is a former sales/trader with over 15 years of financial markets expertise under its belt.


