Crude Oil keeps calm with US Jobs Report causing mayhem
- Crude Oil trades near the year-to-date low recorded on Thursday below $70.00.
- Sketchy OPEC communication leaves traders in the dark for the next movements.
- The US Dollar Index trades just below 101.00 ahead of the US Employment Report.

Crude Oil consolidates this week’s sharp decline to a fresh year-to-date low below $70.00 for a second day in a row on Friday. Crude Oil prices remain subdued mostly because of the sketchy communication from the Organization of the Petroleum Exporting Countries and its allies (OPEC+). Although several delegates from the consortium might have said that a deal is near to delaying production normalization, markets would have thought that OPEC would come up with far more thorough and impactful measures that would support Crude Oil prices more substantially.
The US Dollar Index (DXY), which tracks the performance of the US Dollar (USD) against a basket of currencies, had a rough ride during the US Jobs Report. The actual number came in softer than expected at 142,000 versus the consensus of 160,00. The previous July number got revised down from 114,000 to only 89,000. This triggered intially a substantial amout of US Dollar weakness, which got fully erased when headlines started to come out that the US Jobs Report mentioned that a lot more overtime was being reported, which could point to susbtantial demand and healthy activity in the US economy still.
At the time of writing, Crude Oil (WTI) trades at $69.07 and Brent Crude at $72.87
Oil news and market movers: That will be it for this week
- Several traders are reporting to Bloomberg that they are taking recent communication from OPEC+ with a pinch of salt, as OPEC only now reacts when Crude Oil prices are falling below their price floor and starts to feel the pain financially.
- The Options market sees options being skewed to more bearish territory, with Brent 25-delta puts deepening recent moves, Bloomberg reports.
- Reuters reports that the recent decline in Crude Oil prices should steady for now, with the recent chunky US drawdowns matching the concern for oversupply after the Energy Information Administration (EIA) saw a chunky 6.873 million drawdown in Crude stockpile against last week’s 0.846 million drawdown, and snapping above the projected 0.9 million drawdown expected.
- Around 1:00 GMT, the weekly Bakeer Hughes US Oil Rig Count will take place. Previous numbers was at 483.
Oil Technical Analysis: What else can they do?
Crude Oil’s price action could dip a little further as the OPEC+ headlines are often obsolete by the end of the trading day. It paints a very clear picture that markets are only hanging some importance on OPEC communication for a short period of time. Clearly, OPEC is not being considered a reliable communicator, which means they will need to step up their game and act more firmly and swiftly if they want to have that price floor in place.
On the upside, the $75.27 will be the first level to head back to. Next, the $77.43 level aligns with both a descending trendline and the 200-day Simple Moving Average (SMA). In case bulls can break above it, the 100-day SMA at $78.00 could trigger a rejection.
The low from August 5 at $71.17 has been broken. From here, the $68.00 big figure is the first level to watch, followed by $67.11, which is the lowest point from the triple bottom seen back in June 2023.
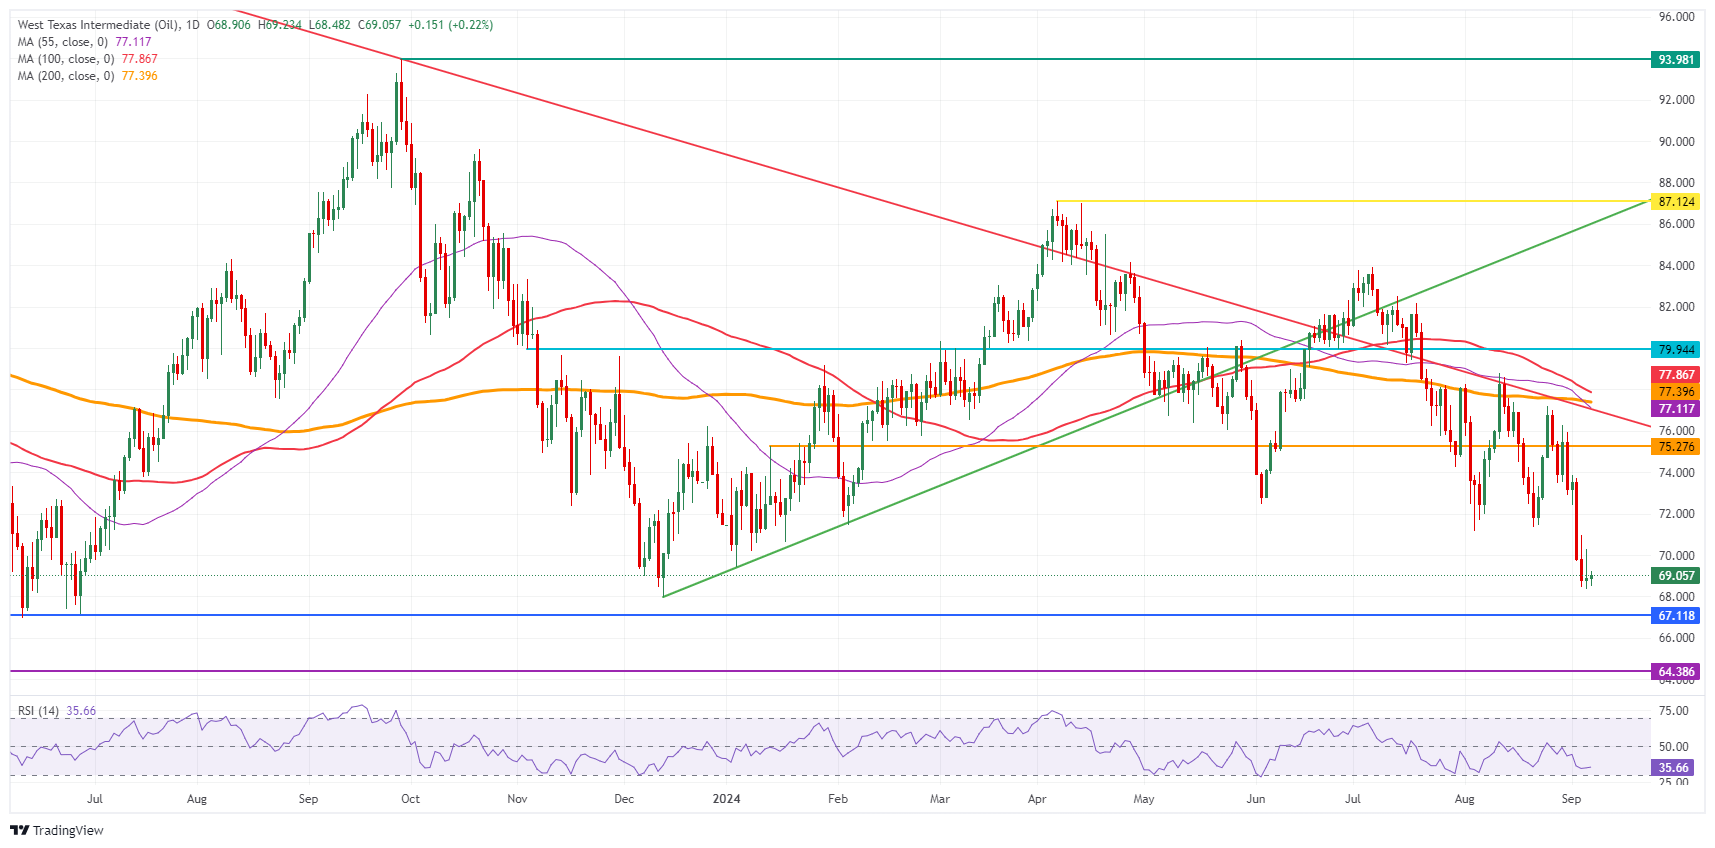
US WTI Crude Oil: Daily Chart
WTI Oil FAQs
WTI Oil is a type of Crude Oil sold on international markets. The WTI stands for West Texas Intermediate, one of three major types including Brent and Dubai Crude. WTI is also referred to as “light” and “sweet” because of its relatively low gravity and sulfur content respectively. It is considered a high quality Oil that is easily refined. It is sourced in the United States and distributed via the Cushing hub, which is considered “The Pipeline Crossroads of the World”. It is a benchmark for the Oil market and WTI price is frequently quoted in the media.
Like all assets, supply and demand are the key drivers of WTI Oil price. As such, global growth can be a driver of increased demand and vice versa for weak global growth. Political instability, wars, and sanctions can disrupt supply and impact prices. The decisions of OPEC, a group of major Oil-producing countries, is another key driver of price. The value of the US Dollar influences the price of WTI Crude Oil, since Oil is predominantly traded in US Dollars, thus a weaker US Dollar can make Oil more affordable and vice versa.
The weekly Oil inventory reports published by the American Petroleum Institute (API) and the Energy Information Agency (EIA) impact the price of WTI Oil. Changes in inventories reflect fluctuating supply and demand. If the data shows a drop in inventories it can indicate increased demand, pushing up Oil price. Higher inventories can reflect increased supply, pushing down prices. API’s report is published every Tuesday and EIA’s the day after. Their results are usually similar, falling within 1% of each other 75% of the time. The EIA data is considered more reliable, since it is a government agency.
OPEC (Organization of the Petroleum Exporting Countries) is a group of 13 Oil-producing nations who collectively decide production quotas for member countries at twice-yearly meetings. Their decisions often impact WTI Oil prices. When OPEC decides to lower quotas, it can tighten supply, pushing up Oil prices. When OPEC increases production, it has the opposite effect. OPEC+ refers to an expanded group that includes ten extra non-OPEC members, the most notable of which is Russia.
Author

Filip Lagaart
FXStreet
Filip Lagaart is a former sales/trader with over 15 years of financial markets expertise under its belt.


