|

AUD/USD rises amid weak ISM PMI, ahead of Aussie’s data

  • AUD/USD rises to 0.6693, buoyed by weaker US business activity data and falling Treasury yields.
  • ISM Manufacturing PMI dips to 48.7, signaling contraction, while S&P Global PMI shows slight recovery.
  • Upcoming US Nonfarm Payrolls report and Australian economic data could influence AUD/USD direction.

The Australian Dollar registered gains of 0.55% versus the Greenback on Monday and opened Asian Tuesday’s session with renewed strength amid falling US yields. Expectations that the Federal Reserve would ease policy in 2024 were fueled by a weaker-than-expected US business activity report. The AUD/USD trades at 0.6693, virtually unchanged.

Aussie Dollar up as US yields drop and undermine the buck

US data was the driver of the day. The Institute for Supply Management (ISM) reported that business activity in the manufacturing sector slowed in May for the third straight month. The ISM Manufacturing PMI decreased from 49.2 to 48.7 for the second straight reading at contractionary ground and below the consensus of 49.6.

Other data from S&P Global highlighted a recovery for the same sector, with the Manufacturing PMI expanding from 50 to 51.3, which is above estimates of 50.9.

The AUD/USD advanced due to overall US Dollar weakness, undermined by lower US Treasury yields. The US 10-year Treasury bond yields plunged eleven basis points to 4.392%, while the US Dollar Index (DXY) dove 0.5% to 104.07. However, US data ahead could change the pair's direction as the release of the US Nonfarm Payrolls report looms.

Fed funds rate futures estimate just 32 basis points of interest rate cuts in 2024, according to data from the Chicago Board of Trade (CBOT).

On Australia’s front, the schedule will feature Company Gross Profits and Business Inventories for the first quarter of 2024, on QoQ figures, along with the Current Account for the same period and the final Retail Sales report for April. month.

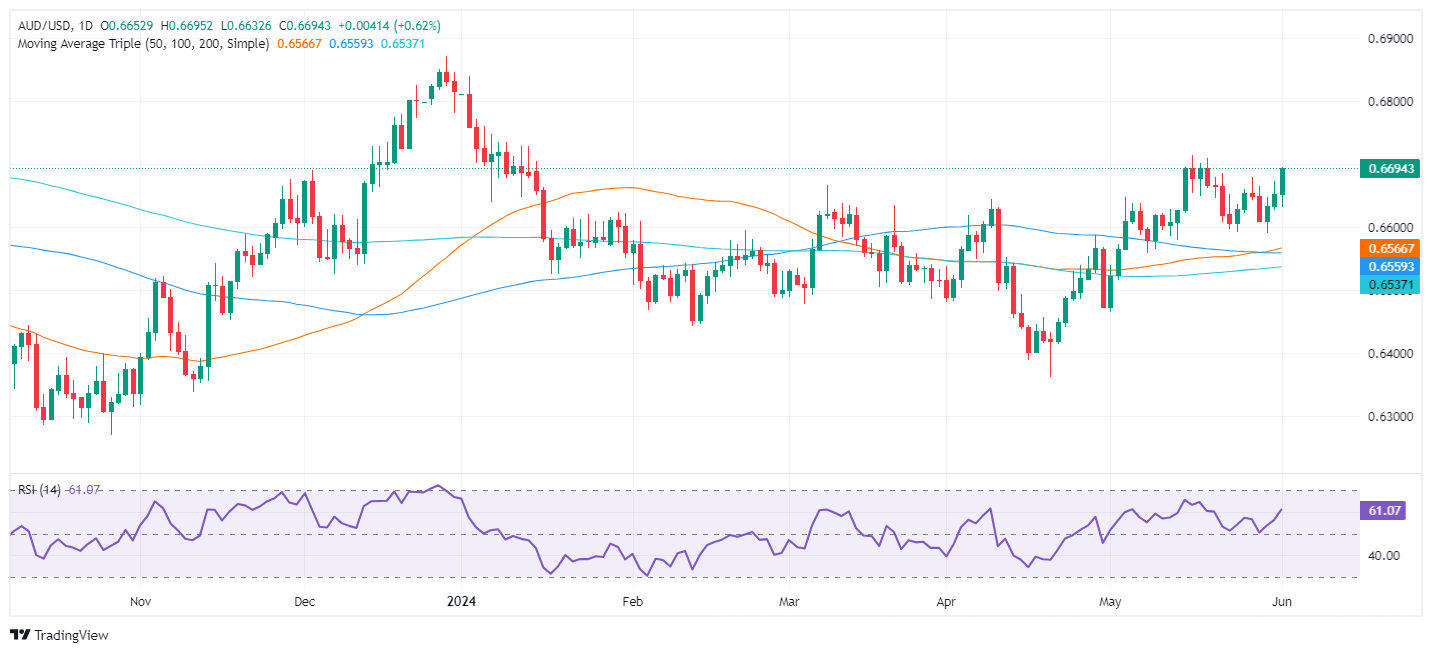
AUD/USD Price Analysis: Technical outlook

From a technical perspective, a ‘double bottom’ chart pattern looms, which could pave the way to test 0.6750 and beyond. However, to confirm its validity, buyers must crack the latest cycle high of 0.6714 before reaching 0.6750 and the 0.6800 figure. Otherwise, if sellers moved in and kept prices below 0.6700, look for a retest of the 0.6600 figure.

AUD/USD

Overview
Today last price0.6692
Today Daily Change0.0039
Today Daily Change %0.59
Today daily open0.6653
 
Trends
Daily SMA200.6636
Daily SMA500.6564
Daily SMA1000.6559
Daily SMA2000.6536
 
Levels
Previous Daily High0.6673
Previous Daily Low0.6627
Previous Weekly High0.668
Previous Weekly Low0.6591
Previous Monthly High0.6714
Previous Monthly Low0.6465
Daily Fibonacci 38.2%0.6655
Daily Fibonacci 61.8%0.6644
Daily Pivot Point S10.6629
Daily Pivot Point S20.6605
Daily Pivot Point S30.6583
Daily Pivot Point R10.6675
Daily Pivot Point R20.6697
Daily Pivot Point R30.6721

Author

Christian Borjon Valencia

Christian Borjon began his career as a retail trader in 2010, mainly focused on technical analysis and strategies around it. He started as a swing trader, as he used to work in another industry unrelated to the financial markets.

More from Christian Borjon Valencia
Share:

Markets move fast. We move first.

Orange Juice Newsletter brings you expert driven insights - not headlines. Every day on your inbox.

By subscribing you agree to our Terms and conditions.

Editor's Picks

EUR/USD consolidates below 1.1700 as markets turn risk-averse

EUR/USD struggles to stage a rebound and trades near the lower limit of its weekly range below 1.1700 on Thursday. The US Dollar benefits from the cautious market stance and doesn't allow the pair to gain traction ahead of mid-tier data releases.

GBP/USD stays in red near 1.3450 on broad USD resilience

GBP/USD stays on the back foot after posting losses for two consecutive days and trades near 1.3450 on Thursday. The souring market mood amid simmering geopolitical tensions make it difficult for the pair to gain traction as focus shift to the the US labor market data.

Gold sticks to intraday losses below $4,450; seems vulnerable to slide further

Gold maintains its offered tone in the second half of the day and trades below $4,450 after posting daily losses on Wednesday. The downfall lacks any obvious fundamental catalyst and could be attributed to some follow-through profit-taking ahead of the release of the US Nonfarm Payrolls report on Friday. 

Pi Network flashes bearish potential as selling pressure mounts

Pi Network trades above $0.2000 at press time on Thursday, following a nearly 2% decline the previous day. Centralized Exchanges have received 1.90 million PI tokens over the last 24 hours, suggesting risk-off sentiment among holders. The technical outlook for the PI token remains bearish, with a risk of a cross below the 20-day Exponential Moving Average. 

2026 economic outlook: Clear skies but don’t unfasten your seatbelts yet

Most years fade into the background as soon as a new one starts. Not 2025: a year of epochal shifts, in which the macroeconomy was the dog that did not bark. What to expect in 2026? The shocks of 2025 will not be undone, but neither will they be repeated.

Pi Network Price Forecast: PI flashes bearish potential as selling pressure mounts

Pi Network trades above $0.2000 at press time on Thursday, following a nearly 2% decline the previous day. Centralized Exchanges have received 1.90 million PI tokens over the last 24 hours, suggesting risk-off sentiment among holders.