AUD/USD Price Analysis: A test of sacred 61.8% Fibo at 0.7050 looks imminent


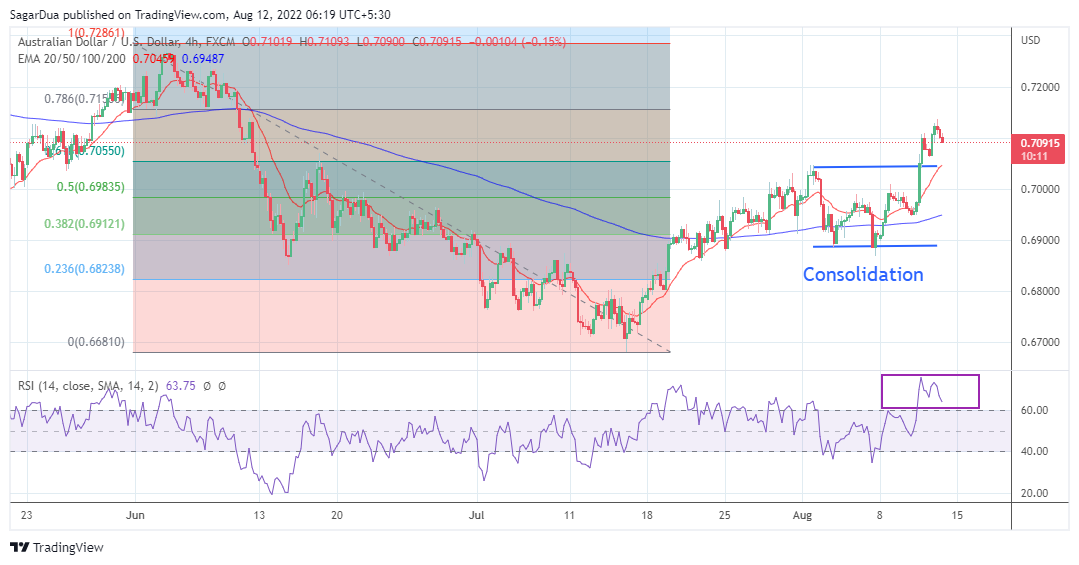
  • A break of the consolidation formed in a 0.6869-0.7047 range strengthened the aussie bulls.
  • An establishment above 61.8% Fibo retracement adds to the upside filters.
  • Advancing 20-and 200-EMAs signal more gains ahead.

The AUD/USD pair has declined gradually below 0.7100 after printing a high of 0.7135 on Thursday. The asset has tumbled after sensing exhaustion in the upside momentum. However, that doesn’t warrant a bearish reversal for now but a corrective move, which is healthy for a decent uptrend.

On a four-hour scale, the asset has given an upside break of the consolidation formed in a broader range of 0.6869-0.7047, which has strengthened the aussie bulls. Also, the asset is auctioning above the 61.8% Fibonacci retracement (which is placed from June 3 high at 0.7283 to July 14 low at 0.6681) at 0.7054. For resuming an upside journey, a test of 61.8% Fibo is critical for the aussie bulls.

The 20-and 200-period Exponential Moving Averages (EMAs) at 0.7052 and 0.6950 respectively are advancing sharply, which adds to the upside filters.

Meanwhile, the Relative Strength Index (RSI) (14) is established in the bullish range of 60.00-80.00, which signals a continuation of upside momentum.

A pullback near 61.8% Fibo retracement at 0.7054 will drive the asset towards Thursday’s high at 0.7137.  A latter breach will expose the asset for more upside towards 78.6% Fibo at 0.7156.

Alternatively, a drop below Wednesday’s low at 0.6951 will drag the asset towards the previous week’s low at 0.6869, followed by 23.6% Fibo retracement at 0.6824.

AUD/USD Price Analysis

AUD/USD

Overview
Today last price 0.7094
Today Daily Change -0.0012
Today Daily Change % -0.17
Today daily open 0.7106
 
Trends
Daily SMA20 0.6951
Daily SMA50 0.6942
Daily SMA100 0.7088
Daily SMA200 0.7153
 
Levels
Previous Daily High 0.7137
Previous Daily Low 0.6963
Previous Weekly High 0.7048
Previous Weekly Low 0.6869
Previous Monthly High 0.7033
Previous Monthly Low 0.668
Daily Fibonacci 38.2% 0.707
Daily Fibonacci 61.8% 0.7029
Daily Pivot Point S1 0.7
Daily Pivot Point S2 0.6894
Daily Pivot Point S3 0.6826
Daily Pivot Point R1 0.7174
Daily Pivot Point R2 0.7243
Daily Pivot Point R3 0.7348


Share: Feed news

Information on these pages contains forward-looking statements that involve risks and uncertainties. Markets and instruments profiled on this page are for informational purposes only and should not in any way come across as a recommendation to buy or sell in these assets. You should do your own thorough research before making any investment decisions. FXStreet does not in any way guarantee that this information is free from mistakes, errors, or material misstatements. It also does not guarantee that this information is of a timely nature. Investing in Open Markets involves a great deal of risk, including the loss of all or a portion of your investment, as well as emotional distress. All risks, losses and costs associated with investing, including total loss of principal, are your responsibility. The views and opinions expressed in this article are those of the authors and do not necessarily reflect the official policy or position of FXStreet nor its advertisers. The author will not be held responsible for information that is found at the end of links posted on this page.

If not otherwise explicitly mentioned in the body of the article, at the time of writing, the author has no position in any stock mentioned in this article and no business relationship with any company mentioned. The author has not received compensation for writing this article, other than from FXStreet.

FXStreet and the author do not provide personalized recommendations. The author makes no representations as to the accuracy, completeness, or suitability of this information. FXStreet and the author will not be liable for any errors, omissions or any losses, injuries or damages arising from this information and its display or use. Errors and omissions excepted.

The author and FXStreet are not registered investment advisors and nothing in this article is intended to be investment advice.

Recommended content


Recommended content

Editors’ Picks

EUR/USD regains traction, recovers above 1.0700

EUR/USD regains traction, recovers above 1.0700

EUR/USD regained its traction and turned positive on the day above 1.0700 in the American session. The US Dollar struggles to preserve its strength after the data from the US showed that the economy grew at a softer pace than expected in Q1.

EUR/USD News

GBP/USD returns to 1.2500 area in volatile session

GBP/USD returns to 1.2500 area in volatile session

GBP/USD reversed its direction and recovered to 1.2500 after falling to the 1.2450 area earlier in the day. Although markets remain risk-averse, the US Dollar struggles to find demand following the disappointing GDP data.

GBP/USD News

Gold holds around $2,330 after dismal US data

Gold holds around $2,330 after dismal US data

Gold fell below $2,320 in the early American session as US yields shot higher after the data showed a significant increase in the US GDP price deflator in Q1. With safe-haven flows dominating the markets, however, XAU/USD reversed its direction and rose above $2,340.

Gold News

XRP extends its decline, crypto experts comment on Ripple stablecoin and benefits for XRP Ledger

XRP extends its decline, crypto experts comment on Ripple stablecoin and benefits for XRP Ledger

Ripple extends decline to $0.52 on Thursday, wipes out weekly gains. Crypto expert asks Ripple CTO how the stablecoin will benefit the XRP Ledger and native token XRP. 

Read more

After the US close, it’s the Tokyo CPI

After the US close, it’s the Tokyo CPI

After the US close, it’s the Tokyo CPI, a reliable indicator of the national number and then the BoJ policy announcement. Tokyo CPI ex food and energy in Japan was a rise to 2.90% in March from 2.50%.

Read more

Forex MAJORS

Cryptocurrencies

Signatures