AUD/JPY Price Analysis: Struggles to break through 38.2% Fibo. after Chinese trade data
- AUD/JPY stages a goodish recovery from a two-week low touched earlier this Friday.
- The emergence of fresh selling around the JPY is seen as a key factor lending support.
- The technical setup warrants caution before positioning for any further intraday gains.

The AUD/JPY cross attracts some dip-buyers near the 106.75 region, or a two-week trough touched during the Asian session on Friday and stalls the previous day's retracement slide from its highest level since May 1991. The intraday move-up is sponsored by a combination of factors and lifts spot prices to the 107.70 region, or a fresh daily peak in the last hour.
The Japanese Yen (JPY) meets with a fresh supply in the absence of any concrete evidence that Japanese authorities stepped into the FX market to support the domestic currency. Apart from this, the underlying strong bullish sentiment across the global equity markets undermines the safe-haven JPY and benefits the risk-sensitive Aussie, which further draws support from bets that the Reserve Bank of Australia (RBA) could raise rates again.
Meanwhile, Chinese data released this Friday showed that the trade surplus, in Chinese Yuan terms, widened to CNY703.73 billion from the previous figure of CNY586.40 billion. Additional details of the report revealed that exports rose 10.7% YoY in June vs. 11.2% seen in May, while the country’s imports dropped 0.6% YoY during the reported month vs. the 5.2% previous. This, however, does little to provide any impetus to the AUD/JPY cross.
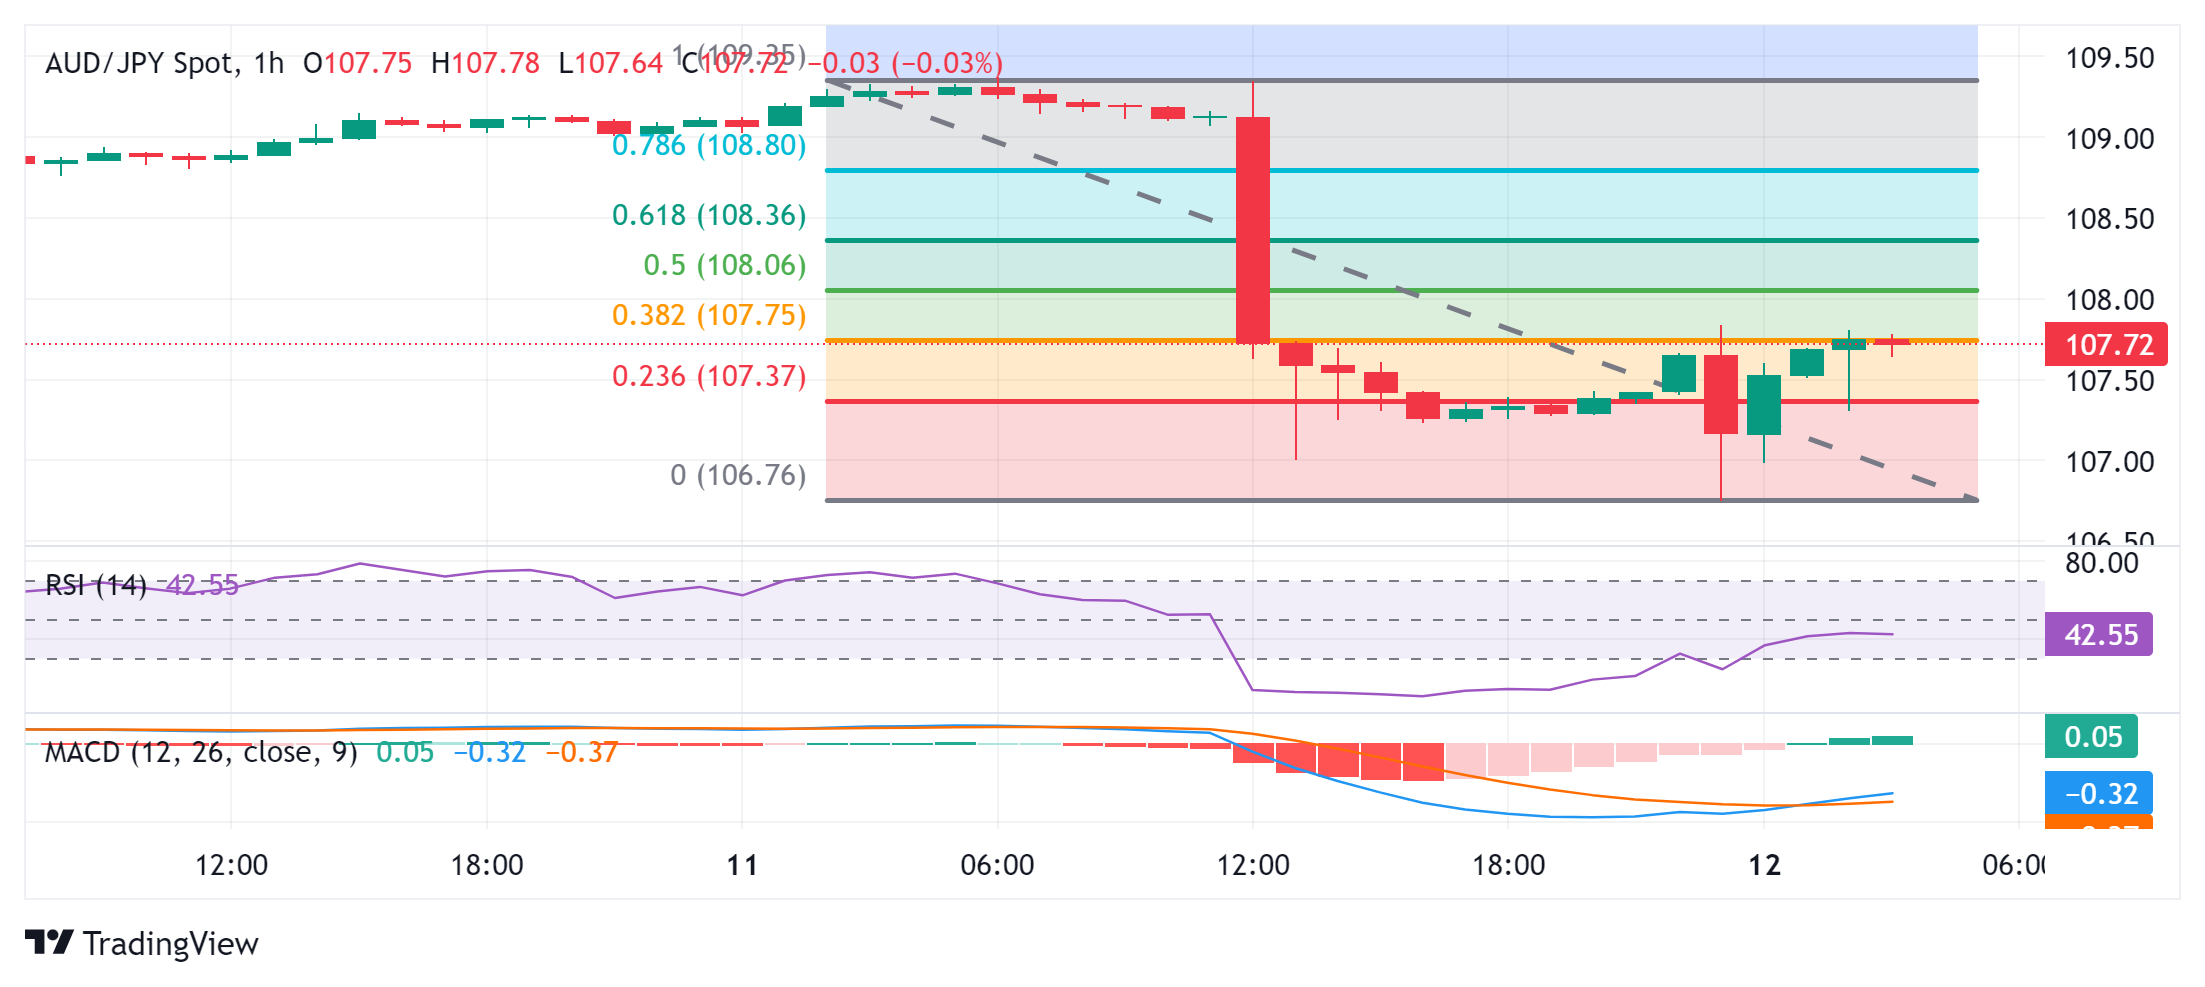
From a technical perspective, spot prices, so far, have been struggling to build on the strength beyond the 38.2% Fibonacci retracement level of the downfall from the overnight swing high. Moreover, oscillators on hourly charts are still holding in the negative territory and warrant some caution for bullish traders. A sustained strength beyond the said barrier, however, should pave the way for a further intraday appreciating move.
The AUD/JPY cross might then aim to reclaim the 108.00 mark, which now coincides with the 50% Fibo. level. Some follow-through buying will suggest that the corrective pullback has run its course and set the stage for the resumption of the uptrend witnessed over the past month or so.
On the flip side, the 107.35 area, or the 23.6% Fibo. level now seems to protect the immediate downside ahead of the 107.00 mark and the Asian session low, around the 106.75 region. A convincing break below will be seen as a fresh trigger for bearish traders, making the AUD/JPY cross vulnerable to accelerate the fall further towards the 106.50-106.40 intermediate support en route to the 106.00 mark and the 105.65 region.
AUD/JPY 1-hour chart
Economic Indicator
Trade Balance CNY
The Trade Balance released by the General Administration of Customs of the People’s Republic of China is a balance between exports and imports of total goods and services. A positive value shows trade surplus, while a negative value shows trade deficit. It is an event that generates some volatility for the CNY. As the Chinese economy has influence on the global economy, this economic indicator would have an impact on the Forex market. In general, a high reading is seen as positive (or bullish) CNY, while a low reading is seen as negative (or bearish) for the CNY.
Read more.Last release: Fri Jul 12, 2024 03:00
Frequency: Monthly
Actual: 703.73B
Consensus: -
Previous: 586.4B
Author

Haresh Menghani
FXStreet
Haresh Menghani is a detail-oriented professional with 10+ years of extensive experience in analysing the global financial markets.