Apple Stock Deep Dive: AAPL price target at $100 on falling 2023 revenues
- Apple has recently lost its status as the world's most valuable company to Saudi Aramco.
- The tech giant faces supply chain headwinds, margin shrinkage and demand destruction in 2023.
- AAPL stock is down 20% year-to-date and likely has not bottomed.

Apple’s (AAPL) last quarterly earnings report on April 28 was solid, with earnings and revenue both beating consensus analyst forecasts. However, Apple management was downbeat on the conference call, highlighting growing problems related to supply chain issues and inflationary headwinds. We believe the pandemic and associated monetary stimulus have resulted in a generational pulling forward of demand, leading to a risk of a 2023 onwards multi-year low in iPhone demand.
Also read: Tesla Stock Deep Dive: Price target at $400 on China headwinds, margin compression, lower deliveries
New iPhone models will not have the same 5G kicker that the iPhone 13 benefited from and are likely to have noticeably higher sticker prices. 78% of Apple iPhone users are under the age of 35, exactly the cohort who will see disposable incomes hurt most by inflation. This age cohort has fewer savings to fall back on and less of an asset base to cushion any inflationary pressure. The caveat is that this age group spends a much larger portion of its income on discretionary purchases in good economic environments due to a lower level of rent and mortgage payments.
For now, incomes remain strong in the face of rising inflation and a tight labor market, but economies are reaching the peak of this cycle in our view. With stock markets being forward-looking, we are taking a downbeat view of 2023 earnings and so a reduced price target versus our peers. We also take note of recent weakness in the Chinese smartphone market with data on May 16 showing shipments down 40.5% annually. China represents 20% of Apple’s revenue, but operating margins from China are significantly higher than in other regions for Apple.
We expect 2022 to remain on track for forecasts, but model 2023 with revenues falling 10% and margin compression due to rising input costs and inflationary pressures continuing. For 2024, we see revenues and margins both flat.
This leads us to a price target of $100 based on traditional P/E, EV/EBITDA and intrinsic valuation methods which we go through in detail below.
Apple overview
Apple manufacturers and designs consumer technology products. The most noteworthy are the iPhone and iPad. The company also manufactures its smartwatch, the Apple Watch, and operates on a global basis. Apple was founded in 1977 in California by Steve Jobs, Ronald Wayne and Steve Wozniak. Apple initially focused on the PC market before launching and revolutionizing the personal music market with the introduction of the iPod in 2001. This essentially launched the music streaming market, and Apple iTunes was the largest music store in the world but finally succumbed to the rise of streaming in 2019. Apple stock trades under the ticker AAPL.
Apple geographical segmentation
| Annual Business Line by Segment in Millions of U.S. Dollars | ||||||
|---|---|---|---|---|---|---|
| 2021 | 2020 | 2019 | 2018 | 2017 | ||
| Period End Date | 25-Sep-2021 | 26-Sep-2020 | 28-Sep-2019 | 29-Sep-2018 | 30-Sep-2017 | |
| Americas | 42% | 45% | 45% | 42% | 42% | |
| Operating Margin (%) | 34.82% | 30.29% | 30.02% | 31.10% | 31.76% | |
| Europe | 24% | 25% | 23% | 24% | 24% | |
| Operating Margin (%) | 36.40% | 32.30% | 31.84% | 31.97% | 30.06% | |
| Greater China | 19% | 15% | 17% | 20% | 20% | |
| Operating Margin (%) | 41.69% | 37.86% | 37.16% | 38.01% | 38.05% | |
| Japan | 7.8% | 7.8% | 8.3% | 8.2% | 7.7% | |
| Operating Margin (%) | 44.93% | 43.32% | 43.56% | 43.71% | 45.66% | |
| Rest of Asia Pacific | 7.2% | 7.1% | 6.8% | 6.6% | 6.6% | |
| Operating Margin (%) | 37.25% | 34.75% | 34.04% | 35.51% | 34.90% |
Source: Refinitiv and FXStreet calculations
We can see clearly how Asia and China provide the highest margin return for Apple, a fact we have already highlighted concerns over. Below we can see just how dominant the iPhone is to revenue generation, representing over 50% of revenue currently. Apple has chosen in the past to prioritize chips for iPhone production to the detriment of iPad production.
Apple revenue by product
| HISTORICAL (ACTUALS) | FORECAST (MEAN) | ||||||
|---|---|---|---|---|---|---|---|
| FY Sep-19 | FY Sep-20 | FY Sep-21 | % | FY Sep-22 | FY Sep-23 | FY Sep-24 | |
| INCOME STATEMENT | |||||||
| REVENUE | 260,174 | 274,515 | 365,817 | 394,010 | 416,241 | 436,301 | |
| IPAD | 21,280 | 23,724 | 31,862 | 7.45% | 29,415 | 30,124 | 32,126 |
| IPHONE | 142,381 | 137,781 | 191,973 | 51.42% | 203,000 | 211,138 | 242,106 |
| MAC | 25,740 | 28,622 | 35,190 | 10.09% | 39,838 | 39,516 | 44,679 |
| OTHER PRODUCTS | 24,482 | 30,620 | 38,367 | 10.74% | 42,421 | 47,341 | 59,401 |
| SERVICES | 46,291 | 53,768 | 68,425 | 20.30% | 80,134 | 90,785 | 140,529 |
Source: Refinitiv and FXStreet calculations
Apple consensus forecast
Of course, this is a well-followed company with a strong rating from the Wall Street community. Price targets have been following the market lower in a reactionary move.
| Analysts Per level | ||||
|---|---|---|---|---|
| 28-Feb-2022 | 30-Mar-2022 | 30-Apr-2022 | Current | |
| 1 - StrongBuy | 16 | 16 | 15 | 15 |
| 2 - Buy | 23 | 23 | 24 | 24 |
| 3 - Hold | 7 | 7 | 8 | 8 |
| 4 - Sell | - | - | - | - |
| 5 - StrongSell | - | - | - | - |
| Rec Mean | 1.8 | 1.8 | 1.9 | 1.9 |
| Price Target Summary | ||||
| Price Target | Target | |||
| 28-Feb-2022 | 28-Mar-2022 | 28-Apr-2022 | Current | |
| Median | $197.00 | $199.50 | $195.00 | $190.00 |
| Mean | $192.96 | $193.53 | $192.35 | $188.92 |
Source: Refinitiv and FXStreet calculations
Apple key info and metrics
| Market Cap | 2.4 trillion | |
|---|---|---|
| Enterprise Value (EV) | 2.9 trillion | |
| EV/EBITDA | 19 | |
| Free Float | 16.17 billion shares | |
| IPO date | 12-Dec-80 | |
| 52 week high | 182.94 | |
| 52 week low | 123.13 | |
| Short interest | 0.70% |
Source: Refinitiv, TradingView and FXStreet calculations
Apple peer valuation comparison
Once the most valuable company in the world, AAPL justifies itself with some high margins and an impressive return on equity. However, EPS growth rates have been slowing. Apple's price/earnings ratio (P/E) has come down from over 30 in late 2021 and currently is close to the average for the S&P 500 and Nasdaq. Apple's 20-year average P/E ratio is 22, so it has also retraced close to that level.
| Market Cap | Gross margin | FCF | P/E | EV/EBITDA | P/book | P/Sales | EPS growth rate | ROE | |
|---|---|---|---|---|---|---|---|---|---|
| Apple | $2.4 trillion | 43% | $106 billion | 23 | 19 | 37 | 7 | -9% | 149% |
| $1.5 trillion | 57% | $69 billion | 19 | 14 | 5 | 6 | -2% | 31% | |
| Qualcomm | $156 billion | 59% | $7 billion | 14 | 11 | 15 | 5 | 50% | 107% |
| Motorola | $37 billion | 46% | $1 billion | 30 | 20 | 5 | -9% | ||
| Nokia | $29 billion | 39% | $1.5 billion | 16 | 6 | 1.5 | 1 | -3% | 10% |
| Samsung | $362 billion | 40% | $13 billion | 10 | 4 | 1.5 | 1.5 | 24% | 15% |
| S&P 500 | 20 | ||||||||
| Nasdaq | 25 |
Source: Refinitiv, TradingView and FXStreet calculations
Macroeconomic analysis, market cycle and sector background
As we outlined in our Tesla deep dive article (see here), the macroeconomic backdrop continues to deteriorate. The combination of tighter monetary policy from global central banks, rising inflation and higher bond yields has sent risk assets into a bear market in 2022. Geopolitical headwinds from the Russia-Ukraine war have also meant supply chains remain in a state of flux and commodity prices remain at elevated levels. All of these elements will continue to eat into the margins and earnings of all companies.

Apple 2022 % return versus Nasdaq and S&P 500
The Nasdaq and most tech stocks have entered an official bear market, defined as a loss of 20% or more. The S&P 500 has been holding just about above that decline for now. Bear markets on average have losses of nearly 40% from peak valuations and an average time span of 300 days. This bear market should have more time to run then – another 20% approximately if it is to meet the historical average. The key question is whether or not the US economy will go into recession in 2023. Bear markets without accompanying recessions are notably less severe with average peak-to-trough declines of 25%. This is a key metric to understand.
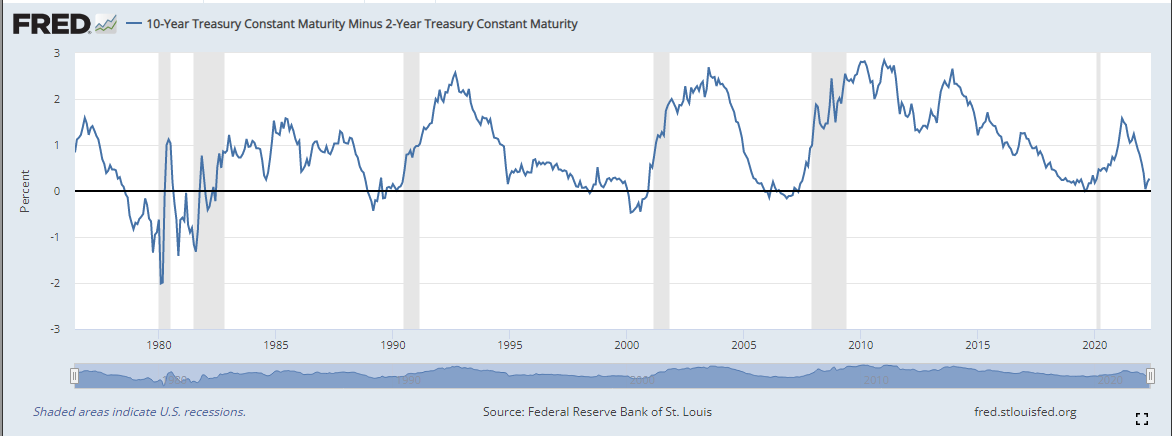
Deutsche Bank was the first major investment bank to predict a US recession by 2023, and there are numerous other indicators showing the likelihood of a recession. The yield curve is a favorite tool, and it does have an accurate prediction quality. Shown below is the yield curve and the associated US recessions in grey following a move into negative territory for the curve.
Also worth pointing out is the level of consumer confidence. The revised benchmark University of Michigan Confidence Indicator on May 27 showed consumer confidence at a low not seen since the Great Financial Crisis. Also of interest is the fact that sentiment levels this low are always associated with a US recession. Again the shaded areas in the chart below are US recessions.

A word on neon
Yet more problems exist on the supply chain front and even one that the market may not have fully come to grips with. Ukraine supplies about half the world's supply of neon gas. Neon is critical to the production of semiconductor chips. Apple needs those chips as does every other major technology manufacturer. See Reuters.
It is likely that major manufacturers such as those supplying Apple will have sufficient inventory built up for the remainder of this year, but 2023 may be a different story. This will be a serious headwind if it goes unresolved.
Apple news and earnings
Apple earnings for the quarter ended March 2022 showed continued strength with revenues up 9% and net income up 6%. iPhone sales were up 6%, but iPad sales fell 2% due to supply chain issues. This is a warning sign for us as Apple had telegraphed earlier in the year that it would prioritize chips for iPhone usage over the iPad.
As mentioned above, Chinese shipments of smartphones fell 40.5% in March and in its last quarter earnings Apple’s China sales dropped 3%.
Apple valuation analysis and fair value
We run standard DCF analysis using both a value in perpetuity approach and EV/EBITDA multiples. Current forecasts give us a fair value of $112 or $120 using unlevered free cash flows. If we use average analyst forecasts, then we get a much higher estimate of fair value at $184 using the growth in perpetuity model or $127 using EV/EBITDA.
| Apple free cash flows | |||||||
|---|---|---|---|---|---|---|---|
| 2019 | 2020 | 2021 | 2022 est | 2023 est | 2024 est | terminal | |
| EBITDA | 76,477 | 77,344 | 120,233 | 131,277 | 134,950 | 140,046 | |
| EBIT | 63,930 | 66,288 | 108,949 | 119,475 | 123,548 | 128,145 | |
| Tax rate | 15.944% | 14.428% | 13.302% | 16.029% | 15.960% | 15.214% | |
| EBIT (1-t) | 64,284 | 66,185 | 104,239 | 110,236 | 113,412 | 118,739 | 0 |
| D&A | 12,547 | 11,056 | 11,284 | 11,397 | 13,038 | 15,129 | |
| Change in NWC | - | 18,780 | 28,966 | -37,574 | -12,365 | 17,993 | 0 |
| Capital expenditures | 10,495 | 7,309 | 11,085 | 10,801 | 12,102 | 12,843 | |
| Unlevered free cash flows (UFCF) | 41,242 | 29,040 | 52,904 | 125,612 | 100,636 | 72,774 | |
| Free cash flow forecasts | 58,896 | 73,365 | 92,953 | 109,240 | 112,699 | 121,909 | |
| Discount rate (r) | 10% | 10% | 10% | 10% | 10% | 10% | |
| PV of UFCFs | 26,136 | 47,614 | 113,051 | 90,572 | 65,497 | - | |
| PV of FCF | 66,029 | 83,658 | 98,316 | 101,429 | 109,718 | ||
| Stage 1: Sum of present values | 342,869 | ||||||
| Sum of PV using FCF | 459,150 | ||||||
| Growth in perpuatiy valuation | Using Forecast FCF | ||||||
| growth rate | 7% | 7% | |||||
| 2024 UFCF | 77,868 | 130,442 | |||||
| termival value in 2024 | 2,595,605 | 4,348,083 | |||||
| Present Value of Terminal Value | 1,611,667 | 2,699,817 | |||||
| Enterprise value | 1,954,536 | 3,158,967 | |||||
| current net debt | 62928 | 62928 | |||||
| shares outstanding | 16864.919 | 16864.919 | |||||
| equity value | $112 | $184 | |||||
| EBITDA Multiple approach | |||||||
| ebitda multiple | 20 | 20 | |||||
| terminal value in 2024 | 2,800,924 | 2,800,924 | |||||
| PV of term value | 1,739,153 | 1,739,153 | |||||
| ent value | 2,082,023 | 2,198,303 | |||||
| net debt | 62,928 | 62,928 | |||||
| shares outstanding | 16,865 | 16,865 | |||||
| equity value | $120 | $127 |
Source: Refinitiv and FXStreet calculations
However, we then adjust for our lowered revenue and margin forecasts. We are estimating Apple revenues fall by approximately 10% in 2023 and then remain flat for 2024. This as mentioned is due to a global recession and global central bank stimulus that has essentially pulled forward multiple years of demand into the pandemic period. We are already seeing this unwind across multiple demand profiles in various industries. We expect demand to remain healthy for 2022, but inflation will then see it subside with the aforementioned lack of monetary stimulus also not helping.
Margin compression is a feature of nearly every earnings call this quarter, and we do not expect that to subside. Costs are increasing globally across energy, semiconductors shortages, shipping costs and labor costs. Increased border controls mean globalization, as we know it, is coming to an end, resulting in greater add-on costs for globalized businesses. We forecast a modest reduction in margins back to 2021 levels. We believe this is likely understating the effects, but for now, we will run with a conservative margin compression to 38%.
This gives us fresh forecasts as follows:
| 2022 | 2023 | 2024 | |
|---|---|---|---|
| Revenue | 394,134 | 365,000 | 365,000 |
| Revenue | 394,134 | 365,000 | 365,000 |
| COGS | 223,825 | 226,300 | 226,300 |
| Gross Profit | 170,309 | 138,700 | 138,700 |
| Gross Margin | 43.2% | 38.0% | 38.0% |
| SG&A (& Other) | 28,575 | 30,659 | 34,081 |
| R&D | 21,914 | 21,914 | 21,914 |
| Operating Profit EBIT | 119,820 | 86,127 | 82,705 |
| Operating Margin | 30.4% | 23.6% | 22.7% |
| Other Income/(Expense) | 120 | 861 | 3,608 |
| Pretax Profit | 119,940 | 86,987 | 86,313 |
| Pretax Margin | 30.4% | 23.8% | 23.6% |
| Inc Taxes (& Adjustments) | 19,750 | 14,345 | 15,240 |
| Tax Rate | 16.5% | 16.5% | 17.7% |
| Net Income | 100,190 | 72,642 | 71,073 |
| Net Margin | 25.4% | 19.9% | 19.5% |
| Shares (in millions) | 16,274 | 15,797 | 15,620 |
| GAAP EPS | |||
| Exclusions | |||
| Pro Forma EPS | 6.16 | 4.60 | 4.55 |
| Mean Estimate | 6.14 | 6.56 | 6.91 |
Source: Refinitiv and FXStreet calculations
Running the new numbers into our DCF model above gives us a fair value of $110 using the perpetuity model with Apple’s 5-year average growth rate of 8%. It comes in at $96 using EV/EBITDA. These numbers may sound alarming to some, but this merely returns Apple to where it was trading in 2020.
We can see from the chart below that Apple’s average price/earnings ratio over the past 20 years has been 22.08, so this is quite close to where it is now. Taking our EPS estimate above at $4.60 for 2023 gives us a price target of $101.56.
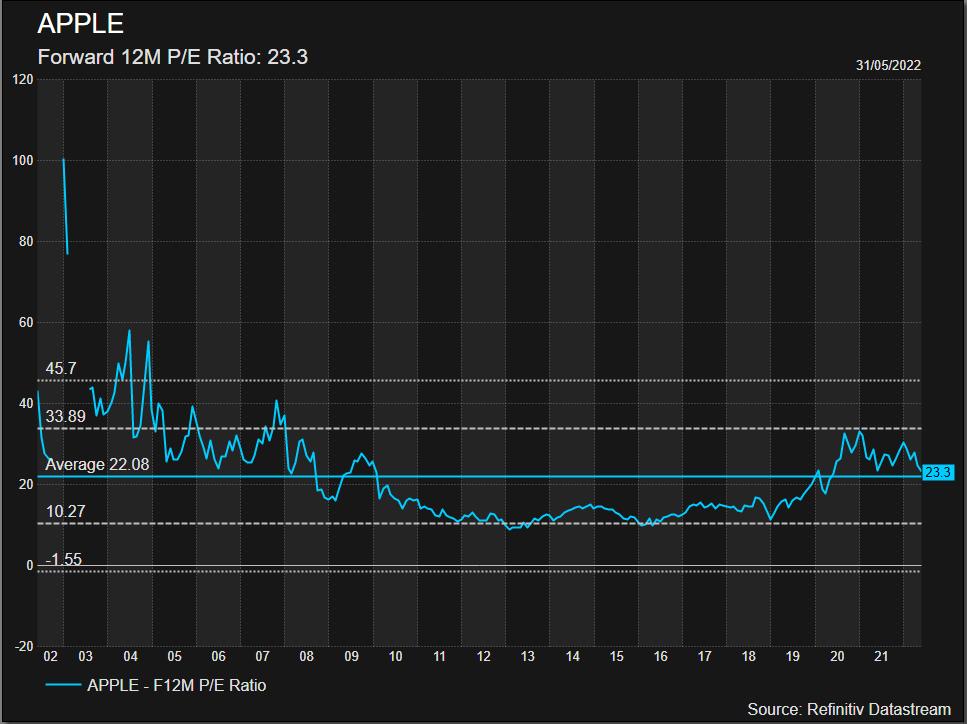
Clearly, using our reduced revenue and margin forecasts gives us a fair value range of $96 to $110.
For ease of use and the psychological preponderance of the market to fixate on round numbers, we place a $100 price target on Apple and a SELL rating.
Apple technical analysis
How does this $100 level fit in with the AAPL stock chart? This $100 level acted as resistance several times in July 2020 before strong earnings on July 30, 2020, supercharged Apple higher and it finally broke above. The current situation has Apple rallying to near $150, but strong support exists at $138.31. A likely break of $138.31 will see a slow move lower. Apple then would find itself in a well-trafficked zone from $130 to $115 with huge volume at those price ranges. Once below $115, volume thins out, meaning a test of $100 becomes more likely. A break of $100 looks likely from a technical perspective as surprisingly volume at $100 is light, meaning low price acceptance. This would be consistent with stop-hunting as round numbers are so often major stop levels. Stops could stretch Apple down to volume support at $90.
We also must take note of the imminent death cross formation where the 50-day moving average crossed below the 200-day moving average. Below $150 Apple remains strongly bearish, only becoming bullish on a break above $165.
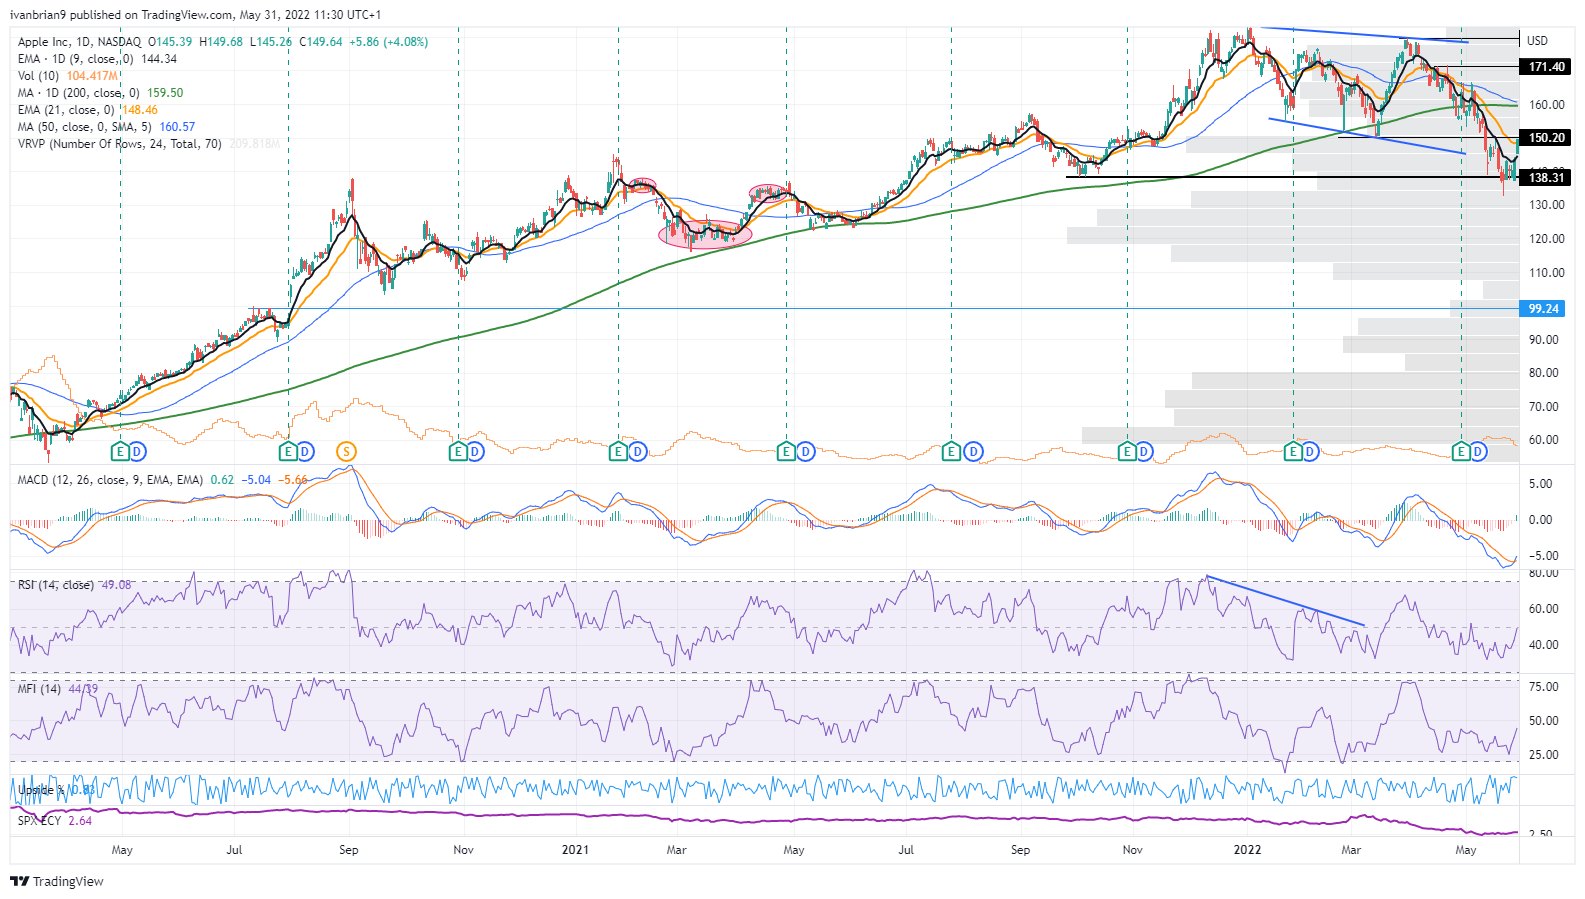
AAPL stock daily chart
Apple price target and recommendation
The AAPL stock technical picture confirms our bearish valuation, and we stick with the $100 price target. This necessitates a Sell rating.
Upside risks to our assumptions:
- Supply chain issues resolve.
- Input costs stabilize.
- Inflation is transitory.
- Chinese demand increases from loose central bank policy – our key risk. China is lowering rates while the rest of the global central banks are tightening. This could encourage middle-class spending in China.
- Major central bank reverse monetary tightening.
- Indian middle-class expansion accelerates quicker than expected. This almost warrants a separate article, but India’s middle class is expanding rapidly (akin to China 20 years ago) and will provide a valuable source of revenue in the 2030s in our view. That is, however, slightly too far out for this analysis.
Apple reported earnings and forecast tables below, the foundation for all our DCF models. Data taken from Refinitiv (Reuters).
| HISTORICAL (ACTUALS) | FORECAST (MEAN) | |||||
|---|---|---|---|---|---|---|
| FY Sep-19 | FY Sep-20 | FY Sep-21 | FY Sep-22 | FY Sep-23 | FY Sep-24 | |
| INCOME STATEMENT | ||||||
| REVENUE | 260174.000 | 274515.000 | 365817.000 | 394009.918 | 416241.124 | 436300.796 |
| Guidance | T | T | T | T | - | - |
| IPAD | 21280.000 | 23724.000 | 31862.000 | 29415.431 | 30123.957 | 32126.000 |
| IPHONE | 142381.000 | 137781.000 | 191973.000 | 203000.051 | 211137.811 | 242105.500 |
| MAC | 25740.000 | 28622.000 | 35190.000 | 39838.055 | 39516.425 | 44679.000 |
| OTHER PRODUCTS | 24482.000 | 30620.000 | 38367.000 | 42420.982 | 47341.417 | 59401.333 |
| SERVICES | 46291.000 | 53768.000 | 68425.000 | 80133.560 | 90785.311 | 140529.333 |
| COST OF GOODS SOLD | 161782.000 | 169559.000 | 212981.000 | 223576.260 | 237413.293 | 249040.200 |
| GROSS INCOME | 98392.000 | 104956.000 | 152836.000 | 170037.095 | 180553.273 | 191255.800 |
| GROSS PROFIT MARGIN | 37.820% | 37.810% | 41.780% | 43.178% | 43.259% | 43.610% |
| Guidance | T | T | T | - | - | - |
| SELLING & MARKETING EXPENSE | 18245.000 | 19916.000 | 21973.000 | 24512.000 | 28016.000 | 31351.000 |
| SG&A EXPENSE | 18245.000 | 19916.000 | 21973.000 | 25305.640 | 27401.149 | 27906.822 |
| R&D EXPENSE | 16217.000 | 18752.000 | 21914.000 | 25679.207 | 28838.565 | 31977.008 |
| STOCK BASED COMPENSATION | 6068.000 | 6829.000 | 7906.000 | 8271.273 | 8588.000 | 10703.000 |
| OPERATING EXPENSE | 34462.000 | 38668.000 | 43887.000 | 51052.492 | 57087.446 | 61479.750 |
| Guidance | - | T | T | - | - | - |
| EBITDA | 76477.000 | 77344.000 | 120233.000 | 131277.435 | 134949.803 | 140046.202 |
| EBITDA PER SHARE | 4.113 | 4.410 | 7.129 | 8.279 | 9.059 | 9.960 |
| DEPRECIATION | 12547.000 | 11056.000 | 11284.000 | 11655.010 | 13121.414 | 16168.963 |
| AMORTIZATION | - | - | - | 11974.000 | 11837.000 | 11989.000 |
| DEPRECIATION & AMORTIZATION | 12547.000 | 11056.000 | 11284.000 | 11397.088 | 13038.300 | 15129.413 |
| EBIT | 63930.000 | 66288.000 | 108949.000 | 119475.180 | 123547.557 | 128145.237 |
| INTEREST EXPENSE | 3576.000 | 2873.000 | 2645.000 | 1063.750 | 1054.500 | 2625.000 |
| PRE-TAX PROFIT | 65737.000 | 67091.000 | 109207.000 | 119629.151 | 123994.657 | 128711.109 |
| TAX PROVISION | 10481.000 | 9680.000 | 14527.000 | 19027.015 | 19715.113 | 19939.333 |
| TAX RATE | 15.944% | 14.428% | 13.302% | 16.029% | 15.960% | 15.214% |
| NET INCOME | 55256.000 | 57411.000 | 94680.000 | 100137.706 | 103862.505 | 108012.128 |
| NUMBER OF SHARES OUTSTANDING | 18595.652 | 17528.214 | 16864.919 | 16287.825 | 15819.445 | 15576.490 |
| EARNINGS PER SHARE | 2.973 | 3.280 | 5.610 | 6.140 | 6.563 | 6.914 |
| EBITDA REPORTED | 76477.000 | 77344.000 | 120233.000 | 131626.185 | 136741.280 | 144314.432 |
| PRE-TAX PROFIT REPORTED | 65737.000 | 67091.000 | 109207.000 | 119223.424 | 123402.747 | 128534.715 |
| NET INCOME REPORTED | 55256.000 | 57411.000 | 94680.000 | 100206.943 | 104230.979 | 109448.607 |
| EARNINGS PER SHARE REPORTED | 2.973 | 3.280 | 5.610 | 6.126 | 6.570 | 6.987 |
| DIVIDEND PER SHARE | 0.750 | 0.795 | 0.850 | 0.908 | 0.969 | 1.045 |
| Guidance | - | - | T | - | - | - |
| BALANCE SHEET | ||||||
| CASH AND CASH EQUIVALENTS | 48844.000 | 38016.000 | 34940.000 | 74446.125 | 107420.125 | 92503.250 |
| INVENTORY | 4106.000 | 4061.000 | 6580.000 | 7016.589 | 7381.847 | 9626.750 |
| CURRENT ASSETS | 162819.000 | 143713.000 | 134836.000 | 157842.800 | 195851.100 | 217601.750 |
| TOTAL ASSETS | 338516.000 | 323888.000 | 351002.000 | 353268.097 | 380941.463 | 439496.000 |
| CURRENT LIABILITIES | 105718.000 | 105392.000 | 125481.000 | 135821.900 | 144143.500 | 160377.250 |
| CURRENT DEFERRED REVENUE | 5522.000 | 6643.000 | 7612.000 | 8105.167 | 8333.167 | 8584.000 |
| TOTAL DEBT | 108047.000 | 112436.000 | 125567.000 | 120920.000 | 121389.500 | 63810.500 |
| NET DEBT | 7490.000 | 21493.000 | 62928.000 | -65497.757 | -79660.867 | -84864.307 |
| SHAREHOLDERS EQUITY | 90488.000 | 65339.000 | 63090.000 | 59919.392 | 76393.428 | 107419.457 |
| GOODWILL | - | - | - | 4034.333 | 3269.500 | - |
| NET ASSET VALUE | 90488.000 | 65339.000 | 63090.000 | 60595.997 | 80601.385 | 122422.800 |
| BOOK VALUE PER SHARE | 5.091 | 3.850 | 3.841 | 3.875 | 4.429 | 4.989 |
| TANGIBLE BOOK VALUE PER SHARE | 5.091 | 3.850 | 3.841 | 3.608 | 4.575 | - |
| ENTERPRISE VALUE | 1002641.567 | 1987571.923 | 2523692.600 | 2434148.837 | 2478936.762 | 2475944.821 |
| TANGIBLE BOOK VALUE | 90488.000 | 65339.000 | 63090.000 | 59376.105 | 69036.875 | 85198.578 |
| CASH FLOW STATEMENT | ||||||
| NET WORKING CAPITAL | 57101.000 | 38321.000 | 9355.000 | 46929.250 | 59294.000 | 41301.000 |
| INCOME TAXES PAID | 15263.000 | 9501.000 | 25385.000 | - | - | - |
| CASH FLOW FROM OPERATIONS | 69391.000 | 80674.000 | 104038.000 | 122168.783 | 125775.546 | 136212.250 |
| CAPITAL EXPENDITURES | 10495.000 | 7309.000 | 11085.000 | 10800.701 | 12102.423 | 12842.778 |
| Guidance | T | T | - | T | - | - |
| CASH FLOW FROM INVESTING | 45896.000 | -4289.000 | -14545.000 | -24828.300 | -8069.500 | -12109.000 |
| FREE CASH FLOW | 58896.000 | 73365.000 | 92953.000 | 109240.074 | 112699.320 | 121908.860 |
| FREE CASH FLOW PER SHARE | 3.168 | 4.190 | 5.509 | 6.960 | 7.326 | 7.860 |
| TOTAL DIVIDENDS | 14119.000 | 14081.000 | 14467.000 | 16883.115 | 14919.000 | 15122.750 |
| CASH FLOW FROM FINANCING | -90976.000 | -86820.000 | -93353.000 | -106606.000 | -88479.636 | -85267.750 |
| CASH FLOW PER SHARE | 3.733 | 4.602 | 6.170 | 7.183 | 7.827 | 8.543 |
| VALUATION METRICS | ||||||
| RETURN ON ASSETS | 15.690% | 17.330% | 28.059% | 28.572% | 28.183% | 28.500% |
| RETURN ON EQUITY | 55.920% | 73.680% | 147.439% | 156.580% | 147.398% | 140.181% |
| RETURN ON CAPITAL EMPLOYED | 27.460% | 30.340% | 48.310% | 54.100% | 57.000% | 56.900% |
| RETURN ON INVESTED CAPITAL | 54.550% | 65.190% | 74.927% | 72.450% | 70.050% | - |
| PRICE/SALES RATIO | - | - | 6.059% | 6.140% | 5.470% | 5.120% |
Like this article? Help us with some feedback by answering this survey:
Author

Ivan Brian
FXStreet
Ivan Brian started his career with AIB Bank in corporate finance and then worked for seven years at Baxter. He started as a macro analyst before becoming Head of Research and then CFO.


