Open P&L (Profit And Loss) – What is it and why do you need it? [Video]
![Open P&L (Profit And Loss) – What is it and why do you need it? [Video]](https://editorial.fxstreet.com/images/TechnicalAnalysis/Positioning/black-and-white-chessmen-placed-on-many-scattered-us-dollars-gm184624745-17899833.jpg)
What is the “Open P and L (Profit And Loss)?”
The Open P&L is the profit or loss of your position at the current market price. As the market price of your position (e.g. stock, option, Forex or Cryptocurrency) changes, your Open P&L will change. It is not unusual that your Open P&L can change by several hundred or even thousands of dollars throughout the day.
Here’s an example:
Let’s say you bought a stock for $100.
The current price of the stock is $105.
This means that you have an “Open Profit” of $5.
If the price of the stocks drops to $98, your “Open P&L” will be -$2.
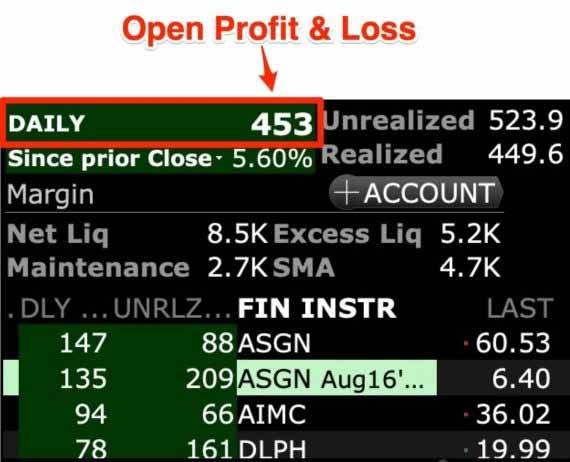
Here’s an example of the “Open Profit & Loss” for a particular day:
Why do you need the “Open P&L?”
The Open P&L gives you a quick overview of the value of your current open positions in your portfolio.
You will see quickly whether your current positions are making your money or losing money.
But the “Open P&L” is very misleading because as long as the trade is open, it will change.
Only when you close a trade you will know how much money you made or lost.
Should you pay attention to the “Open P&L?”
Let me explain it this way:
Both of my kids are sailors.
And here’s how a sailing regatta works:
A regatta is usually 2-4 days, and each day there are several races.
Typically, there are 3-5 races per day. So this means that some regattas have 6 races, while others can have 10-12 races.
The winner of the regatta is the sailor with the lowest score.
Example: If you have a 1 – 1 – 1 – 1, which means that you won four races, you have a score of 4.
So while a regatta is going on, and the sailors are completing races, the score changes ALL THE TIME!
Here’s an example – if you want to follow along:
Right now, my son Julius is competing at The Chubb U.S. Junior Championship.
As I am writing this, they completed 4 out of 9-10 races.
And right now, Julius and his skipper Lucy are in 6th place.
But this will change!
By the end of the regatta, they might move up to 3rd place…
… or they could drop to 10th place.
(Almost) everything is possible!
Of course, it is FUN watching the results throughout the day.
But only at the end of the regatta, we will know the final result.
It’s like trading:
While you have an open position, you can watch the “Open Profit and Loss” all day long.
But it doesn’t matter!
Only when you CLOSE the trade you will know how much money you made or lost.
Summary
If you are watching the Open P&L while you are in a trade, it will drive you crazy!
I have been in trades that have been losing in the first few days, and then they turned around and I was able to exit them with a profit.
And I have had trades that took off in the first few days and then sharply turned around and I exited them with a loss.
Long story short:
Don’t celebrate “open profits” and don’t get upset about “open losses” because trades can turn around quickly.
Being #6 out of 20 boats in The Chubb U.S. Junior Championship is a big deal!
Because sailors from all over the country had to qualify through another regatta to be able to participate here.
So Julius and Lucy are sailing against the best sailors in the nation!
Today, there will be another 3-4 races.
And tomorrow, there will be another 2-3.
And THEN I can look at the score.
Looking at the scores during the regatta is like looking at the “Open P&L” of your trades:
It’s fun and entertaining, but it doesn’t matter… yet.
Hope this helps!
Related read: Using the Options Profit/Loss Graph
I have referred often in these articles to the Options Profit Loss graph. Today, I want to show it explicitly and discuss its uses. First, let’s look not at an option Profit Loss graph, but at a regular price chart of a stock to use an example. I’ve chosen Colgate Palmolive (symbol CL). Keep reading
Author

Markus Heitkoetter
Rockwell Trading
As founder and CEO of Rockwell Trading Services LLC., Markus Heitkoetter has shared his trading methods and ideas with more than 300,000 traders in over 196 countries.
















