Using the Options Profit/Loss Graph

I have referred often in these articles to the Options Profit Loss graph. Today, I want to show it explicitly and discuss its uses.
First, let’s look not at an option Profit Loss graph, but at a regular price chart of a stock to use an example. I’ve chosen Colgate Palmolive (symbol CL).
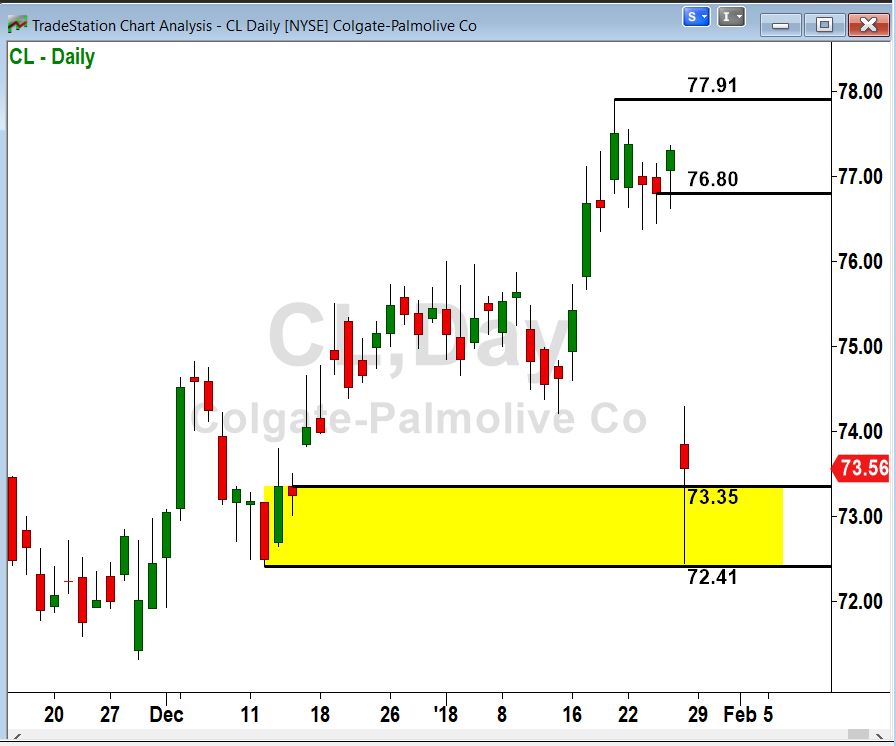
On this date, Colgate had just reported in-line earnings but disappointing sales, and its stock price had dropped by over 6% in a single day.
In cases of earnings surprises like this, it is often true that the immediate move is an overreaction that will be reversed in the near future. This could very well be one of those cases. The stock seemed to have stopped its plunge and begun righting itself.
To capitalize on the rebound move, we could have bought call options. These would increase in value if Colgate stock went back up. Checking the option chain, we found that the May call at the $70 strike could be bought for $4.875 per share ($487.50 per option contract).
How much might we expect to make if we bought those calls and were right about CL regaining its pre-earnings price in the near future?
Answering that question requires an options profit loss graph. Although we know that a call option will go up in value when its underlying stock does, the movement is not linear. There is no back-of-the envelope way to calculate what an option price will be after a move in the stock price. We need the mathematical horsepower of the option profit loss graph to do it. All trading platforms provide some version of this tool. The details of their operations are a little different, but all are basically similar in their function.
That function is to show us how much money could be made or lost on an option position, when its underlying stock moves to a different price.
Below is the option P/L graph for the May $70 CL Calls, made as of January 28, 2018.

This diagram is actually three P/L graphs (the thin white, purple and cyan lines that slope upward from left to right). Each of the three lines is calculated as of a different date. This is to show that the price of an option is affected not just by stock price, but also by time. I selected the current date (1/28/18, white line); another date about two months away (3/24/18, purple line); and the expiration date (May 18, 2018, cyan line).
The three graphs all take $487.50, the current market value of the option, as its initial cost. Each line plots the profit or loss that would be made on the option if liquidated on the date specified for that line, with the stock at that time at the price indicated on the horizontal axis.
The graphs take a little getting used to, but the effort is well worth it. The stock price, instead of being on the vertical axis like a price chart, is on the horizontal axis. And the vertical axis shows profit or loss from a fixed starting point (the $487.50 current value of the options).
In the table beneath the graph, on the bottom line, is a row of data that would apply if the stock price were to rise to $81.08 today. We can tell this because $81.08 is the amount shown in the first column, labeled Price; and because under the heading “Plot” the value is “Plot 1.” Today’s date (1/28/18) is shown as the first of the three dates in the legend on the chart, in the box (plot number 1). In the “Value” column for this line, the amount shown is $1,142.37. This means that if CL stock were to rise to $81.08 today, the value of our $70 strike call option would be that amount. Since our cost is $487.50, our profit would be $1,142.37 – $487.50, or $654.87. We can see that the amount under the heading “Theo P/L” is $654.87.
I chose $81.08 as an example price, called a price ‘slice,’ just because it was a high price that would be unlikely to be reached today. Notice that there are two other rows of data in the table. These are for the current price ($73.87) and a price that is much lower ($67.30). In fact, you can show as many price slices as you want and specify a different price for each.
On the row whose Price is $67.30, we can see that the Value of the option would be only $110.71. Since our cost was $487.50, that would represent a loss of $487.50 – $110,71, or $376.79. That amount is shown in the “Theo P/L” column for that line.
Usually, we use three slices: one for the price at which the stock is now; one for the stop-loss price, and one for a target price. The Value column then shows us what the value of the option position would be with the stock at each of those prices. We can then evaluate risk vs. reward on the trade to determine if we should take it.
That’s all we have space for today. There is much more that the profit loss graph can do, and we’ll look at some of those features in future articles. If you trade options, be sure to become fluent in the use of the P/L graphing tool that comes with your platform
Author

Russ Allen
Online Trading Academy
Russ decided to make his lifelong passion, trading, his full-time occupation in 2003. With extensive experience in trading, education, and business in general, he sought the highest-quality trading education he could find.


