Bitcoin Weekly Forecast: BTC bears aren’t done yet
- Bitcoin price edges below $67,000 on Friday after losing nearly 5% so far this week.
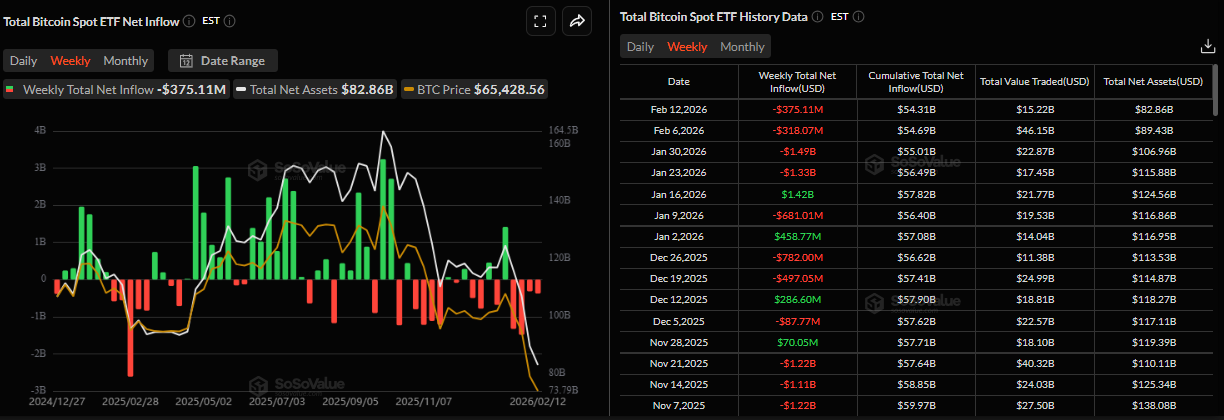
- US-spot ETFs record an outflow of $375.11 million through Thursday, pointing to the fourth consecutive week of withdrawals.
- Report notes that large daily realized losses point to insufficient capitulation and leave room for deeper correction as a structural bottom is not there yet.

Bitcoin (BTC) price slips below $67,000 at the time of writing on Friday, remaining under pressure and extending losses of nearly 5% so far this week. Institutional demand for the Crypto King continues to weaken, pointing to a fourth consecutive week of withdrawals from spot BTC Exchange Traded Funds (ETFs). Meanwhile, CryptoQuant data indicate that a structural bottom may not yet be in place, as signs of full capitulation remain absent, leaving the door open for further downside.
Fading institutional demand
Institutional demand for Bitcoin continues to weaken. According to SoSoValue data, spot Bitcoin ETFs outflows remained robust through Thursday, totalling $375.11 million. These withdrawals point to a fourth consecutive weekly outflow, failing to support BTC prices. If this trend continues, BTC could see further correction in the upcoming weeks.
However, on the corporate front, Strategy (MSTR) announced on Monday that it purchased 1,142 BTC, bringing its total holdings to 714,644 BTC. This purchase highlights the firm’s continued aggressive accumulation strategy and long-term conviction in Bitcoin, despite ongoing market weakness, as its average purchase price is $76,056.
Mixed macroeconomic data caps BTC recovery
On the macroeconomic front, global risk sentiment has weakened, limiting Bitcoin’s recovery this week.
On Wednesday, the United States (US) Bureau of Labor Statistics (BLS) released the delayed January Nonfarm Payrolls (NFP) data. The data came in stronger than expected, adding 130K jobs in quite an auspicious start to the year, while the Unemployment Rate ticked lower to 4.3%, and Average Hourly Earnings held steady at 3.7% over the last twelve months.
This surprise improvement in the employment sector is good news for the Fed, which has lately worried that the labor market had cooled a bit too much. Yet it’s also worth reminding that an overly strong labor market also works against interest rate cuts.
Market participants were forced to scale back their bets for a Federal Reserve (Fed) rate cut in March. This keeps the USD Index (DXY) afloat above a two-week low at $95.55, which in turn caps the recovery of riskier assets such as Bitcoin. Meanwhile, traders are still pricing in the possibility that the US central bank will lower borrowing costs two more times in 2026.
The January Consumer Price Index (CPI) increased 2.4% on an annual basis, beating expectations of 2.5%. According to the BLS, the Core CPI, which excludes the volatile prices of food and energy, matched experts' expectations of 2.5%. The monthly CPI rose by 0.2%, also beating expectations of 0.3%. Moreover, the report affirms that inflationary pressures are gradually easing, but remain above the Fed's 2% target.
As inflation eases, it affirms investors' expectation of at least two rate cuts in 2026, which could boost the outlook of risk assets, including crypto. Expectations of rate cuts could improve risk appetite as markets regain confidence, supporting the odds of a sustained recovery in Bitcoin price.
Bears still got steam
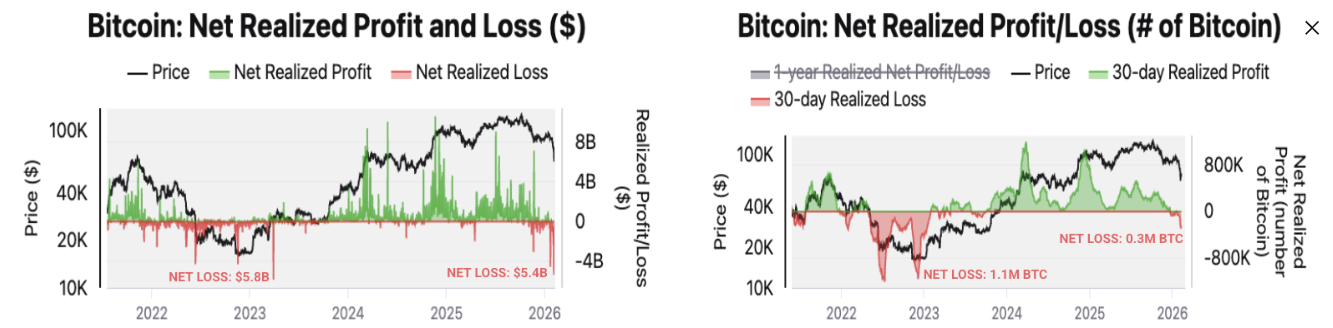
CryptoQuant’s weekly report on Thursday highlighted that large daily realized losses do not yet imply a structural bottom.
The chart below shows that Bitcoin holders have realized the largest daily losses since March 30, 2023, and that these losses are larger than those following the FTX exchange collapse. The net realized losses were $5.4 billion on February 5, when BTC fell from a high of $73,341 to $62,909, a 14% drop in a single day. These losses were the largest since March 2023, when they amounted to $5.8 billion, and larger than the $4.3 billion losses recorded a few days after the FTX collapse of November 2022.
“The scale of these realized losses has led some market analysts to suggest that a price bottom is near,” reports the analyst.
However, monthly cumulative realized losses in Bitcoin terms (right chart) are still much lower than the levels associated with bear market bottoms, as it recorded 0.3 million BTC, compared to 1.1 million BTC at the end of the 2022 bear market.
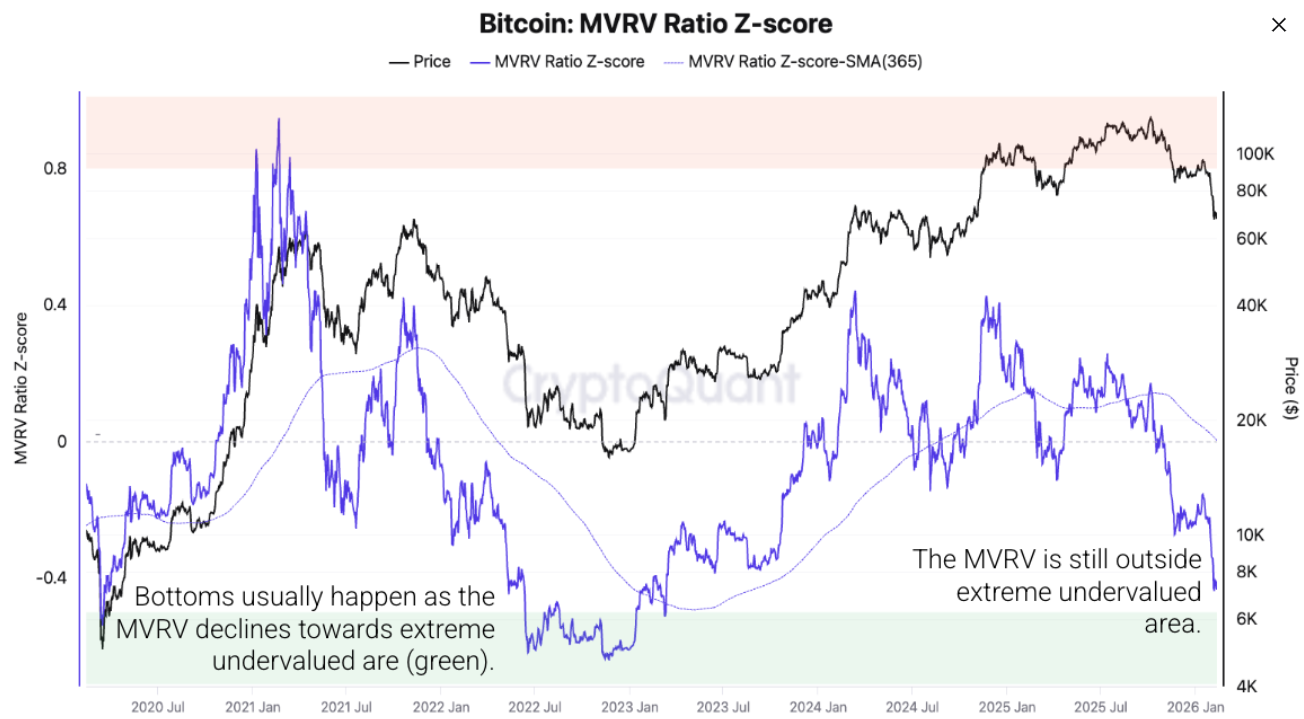
The report further explained that, based on valuation metrics, BTC is nearing its fair value but is not at undervalued levels that have historically indicated a bear market bottom.
The Market Value to Realized Value (MVRV) ratio, as shown below, remains outside the extreme undervalued area (green), where historically market bottoms were formed. Moreover, once MVRV enters this zone, the market has generally required four to five months to establish a sustainable base.
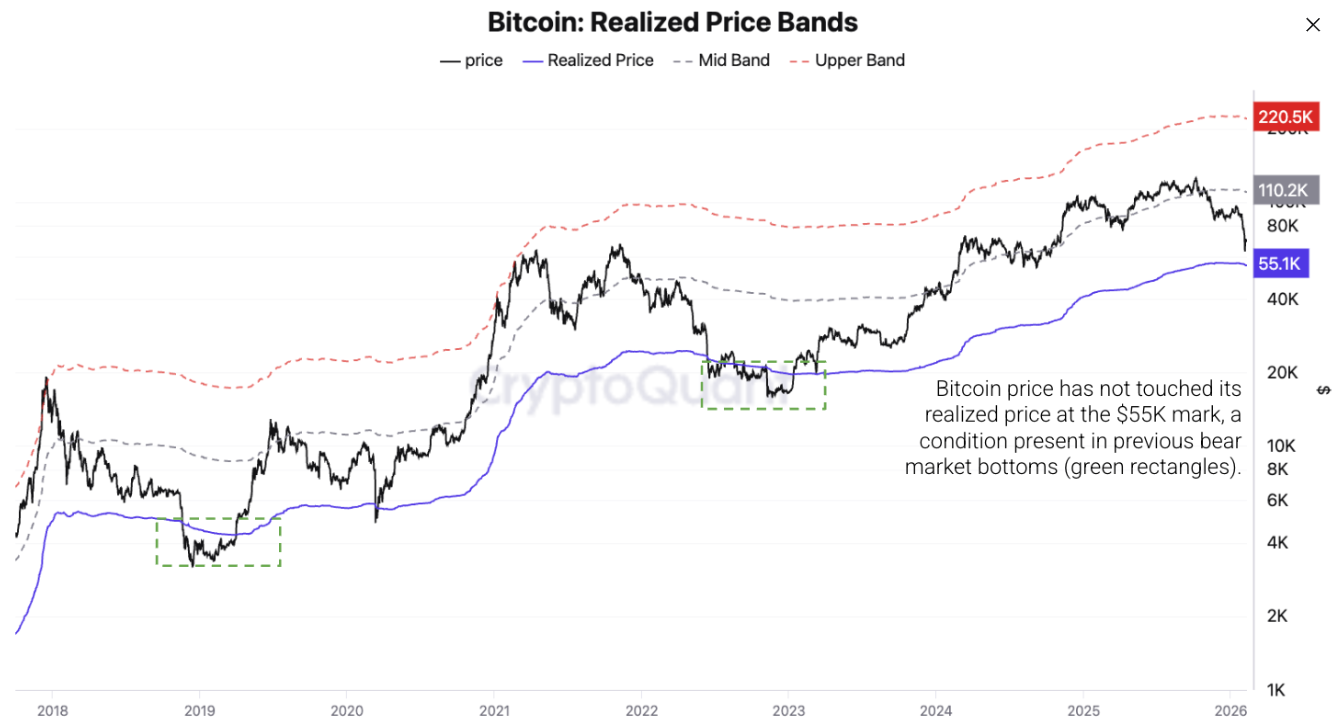
CryptoQuant’s analyst predicts that “Bitcoin’s ultimate bear market bottom is around $55K today.”
Bitcoin’s realized price bands, which have historically been major support areas in previous bear markets, are shown below. Currently, the price of Bitcoin stands 18% above this mark. In the previous two bear markets, the price crossed below it by 24% (November 2022, after the FTX collapse) and 30% (December 2018). Additionally, once the price reaches this level, it tends to stabilize for 4-6 months.
Top-down analysis: Is BTC bottoming, or do bears have steam for further correction?
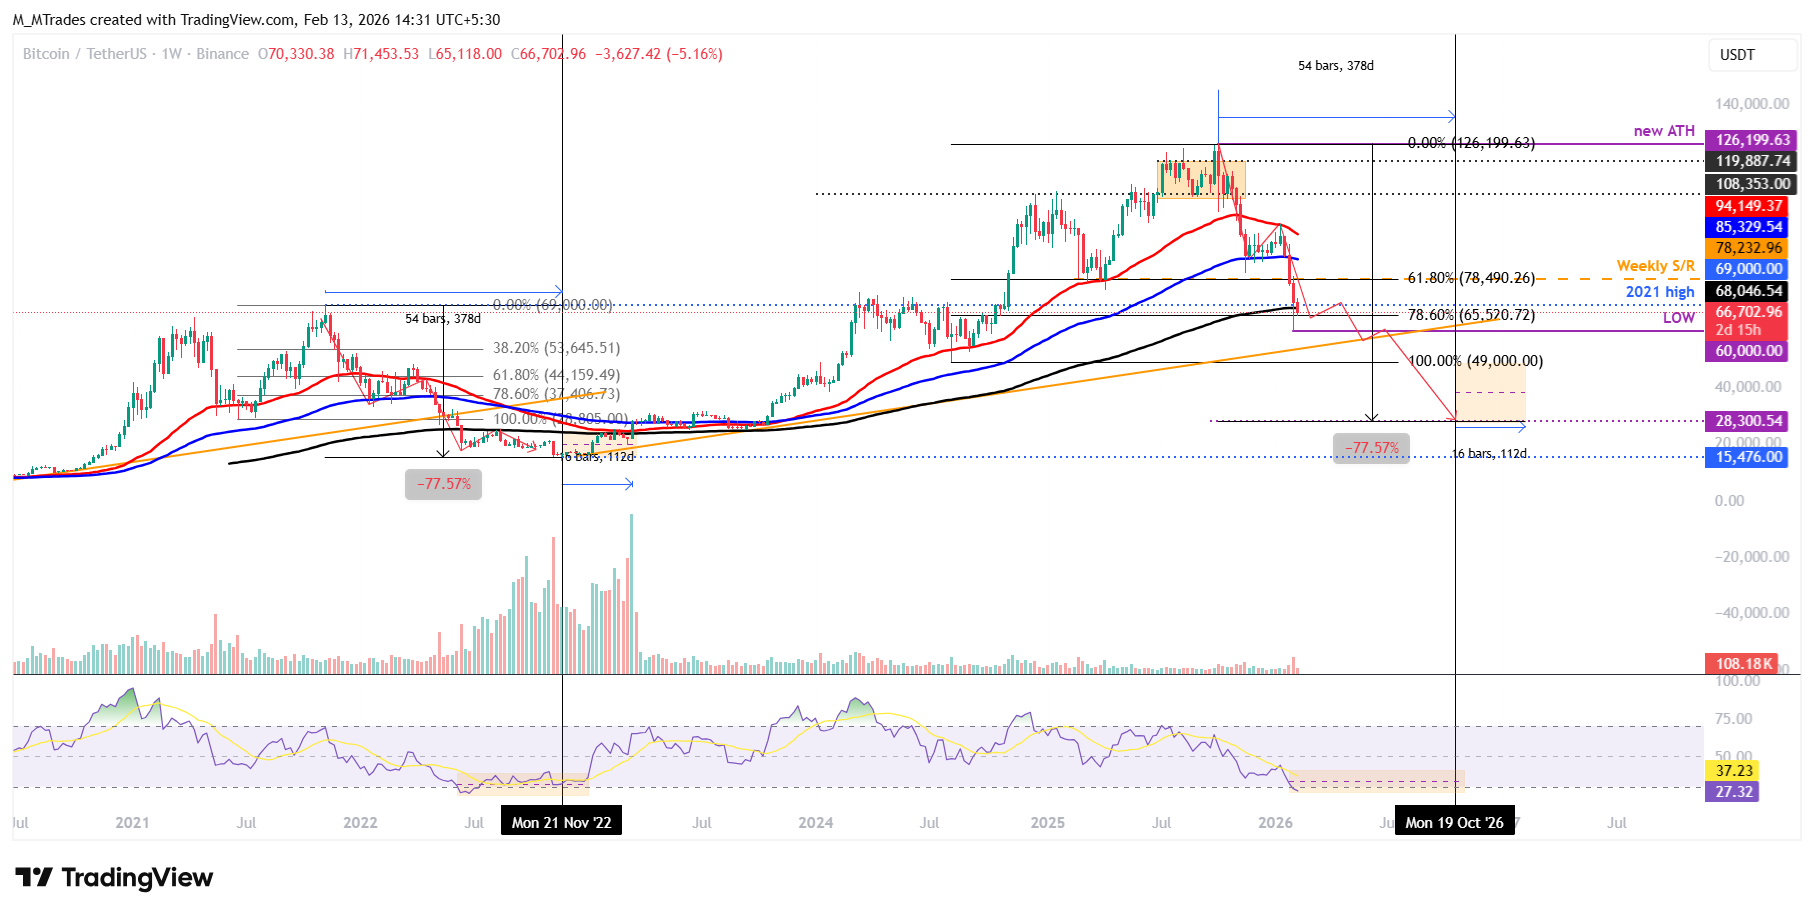
The Bitcoin weekly chart shows price action resembling that of the late-2021-2022 bear market. In 2021, BTC hit a new all-time high (ATH) of $69,000 in November and corrected 77.57% from the high to the 2022 bottom of around $15,476 in November 2022 in 378 days. Then consolidated for the next 112 days, before the start of another bull cycle in 2023.
In the 2025-2026 period, BTC reached a new ATH at $126,199 in October 2025 and has since corrected by 46% through the second week of February, as of writing on Friday, slipping below the 200-week Exponential Moving Average at $68,046.
If the current regime follows the 2021-2022 pattern, BTC could see further correction, reaching a low of $28,300 (77.51% from the 2025 ATH) on October 19, 2026. Then consolidate for the next 112 days before the start of another bull cycle (similarly seen in 2023 as discussed above).
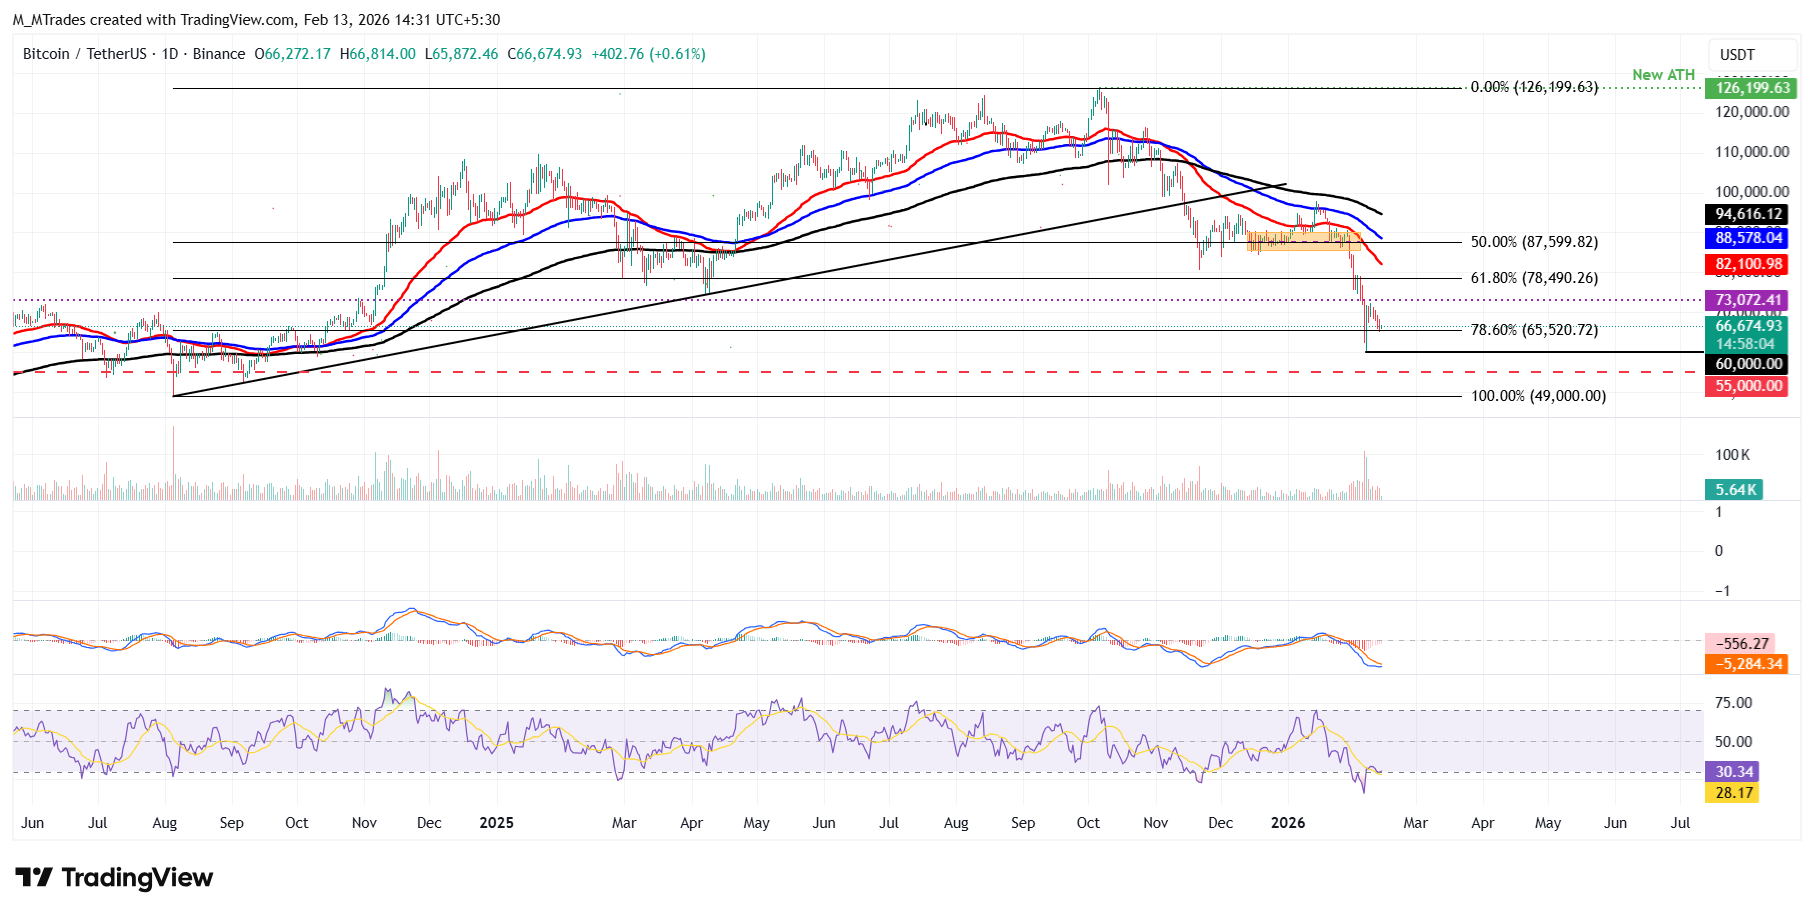
On the daily chart, the Crypto King was rejected near the daily resistance level at $73,072 on Sunday and posted four consecutive red candlesticks, declining 5.5% through Thursday. At the time of writing on Friday, BTC is finding support around the 78.6% Fibonacci retracement (drawn from the August 2024 low of $49,000 to the October 2025 all-time high of $126,199) at $65,520.
If BTC breaks and closes below $65,520, it could extend the decline toward the February 6 low at $60,000.
The Relative Strength Index (RSI) on the daily chart is at 30, pointing downward toward the oversold territory, suggesting bearish momentum is gaining traction. In addition, the Moving Average Convergence Divergence (MACD) in the same period shows a bearish crossover, suggesting a continuation of the downward trend.
On the 4-hour chart, the largest cryptocurrency by market capitalization broke below the lower boundary of a consolidation zone at $67,300 on Thursday, after a long period of sideways trading since Saturday. As of Friday, it is nearing this broken boundary.
If BTC faces rejection from the lower consolidation boundary at $67,300, it could extend the correction to revisit the February 6 low at $60,000.
The Relative Strength Index (RSI) on the 4-hour chart reads 42, below the neutral level of 50, indicating bearish momentum gaining traction. However, the Moving Average Convergence Divergence (MACD) lines are converging, indicating indecision among traders.
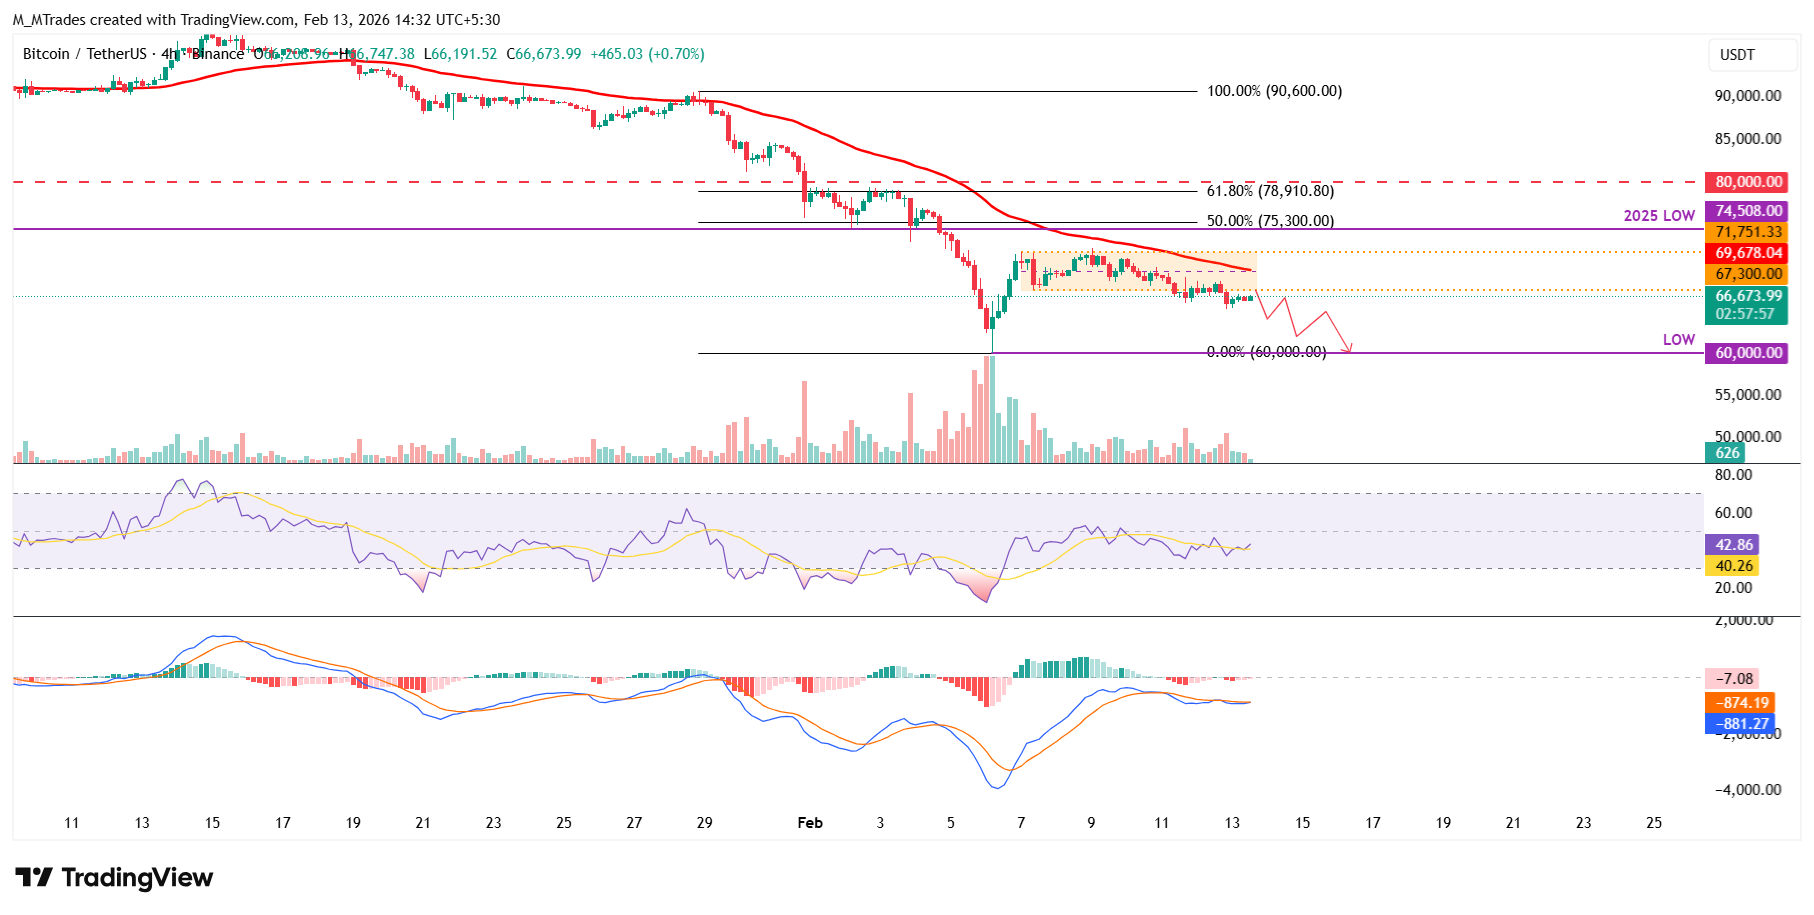
If BTC recovers, it could extend the advance toward the daily resistance at $73,072.
Bitcoin, altcoins, stablecoins FAQs
Bitcoin is the largest cryptocurrency by market capitalization, a virtual currency designed to serve as money. This form of payment cannot be controlled by any one person, group, or entity, which eliminates the need for third-party participation during financial transactions.
Altcoins are any cryptocurrency apart from Bitcoin, but some also regard Ethereum as a non-altcoin because it is from these two cryptocurrencies that forking happens. If this is true, then Litecoin is the first altcoin, forked from the Bitcoin protocol and, therefore, an “improved” version of it.
Stablecoins are cryptocurrencies designed to have a stable price, with their value backed by a reserve of the asset it represents. To achieve this, the value of any one stablecoin is pegged to a commodity or financial instrument, such as the US Dollar (USD), with its supply regulated by an algorithm or demand. The main goal of stablecoins is to provide an on/off-ramp for investors willing to trade and invest in cryptocurrencies. Stablecoins also allow investors to store value since cryptocurrencies, in general, are subject to volatility.
Bitcoin dominance is the ratio of Bitcoin's market capitalization to the total market capitalization of all cryptocurrencies combined. It provides a clear picture of Bitcoin’s interest among investors. A high BTC dominance typically happens before and during a bull run, in which investors resort to investing in relatively stable and high market capitalization cryptocurrency like Bitcoin. A drop in BTC dominance usually means that investors are moving their capital and/or profits to altcoins in a quest for higher returns, which usually triggers an explosion of altcoin rallies.
Author

Manish Chhetri
FXStreet
Manish Chhetri is a crypto specialist with over four years of experience in the cryptocurrency industry.


