Yearn.finance Technical Analysis: YFI hits rock bottom screaming buy
- Yearn.finance embraced support at $9,400 after a devastating plunge from its all-time highs around $44,000.
- YFI/USD shows signs of recovery from a technical perspective, but on-chain metrics hint at stagnation.

Yearn.finance has lost more than 78% of its peak value of approximately $44,000. This drop gives a sneak peek of how the tokens in the decentralized finance (DeFi) sector performed poorly towards the end of the third quarter of 2020. Moreover, the hope for improvement in the last quarter of the year continues to dwindle, with tokens still wallowing in acute selling pressure.
Yearn.finance on the verge of a grand recovery
The DeFi token rose to stardom (becoming the most expensive cryptoasset in the market) immediately after its launch recently dived under $10,000. Amid the desperate hunt for a bottom, YFI seems to have established formidable support at $9,400. At the time of writing, Yearn.finance is trading at $9,440 as bulls begin to nurture a recovery aimed at elevating the price above $10,000.
The bullish outlook is validated by the formation of a descending wedge pattern. The lower trendline has continued to play a vital role in mitigating possible nerve-shattering losses. Simultaneously, the Relative Strength Index (RSI) is in the oversold region and pointing towards a potential recovery.
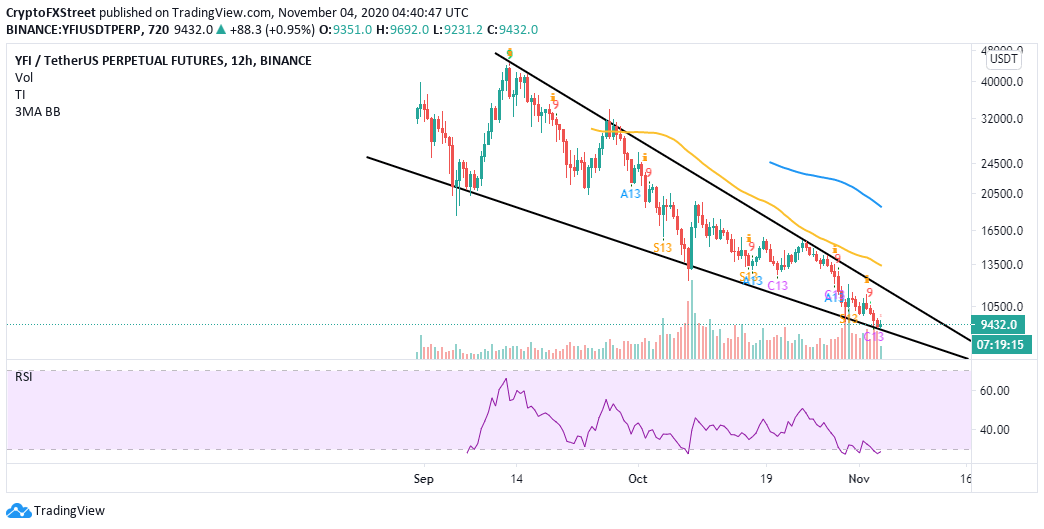
YFI/USD 4-hour chart
The TD Sequential indicator recently flashed multiple buy signals on the 4-hour chart, the 12-hour chart and the daily chart. In other words, support at $9,400 could be the inflection point for YFI; hence it has given credence to the bullish narrative. If the bullish momentum intensified and took down the resistance at $10,000, YFI would begin the grand rally to $13,500 (seller congestion zone highlighted by the 50 Simple Moving Average).
IntoTheBlock's IOMAP shows YFI sitting above an area with an immense buyer congestion zone, which runs from $9,172 to $9,428. Here, 267 addresses had previously bought around 787 YFI. Holding above this zone would continue to encourage more buyers to join the market.
-637400650655738090.png)
YFI IOMAP chart
On the upside, Yearn.finance has a relatively smooth path to levels marginally above $10,000. However, a robust resistance lies between $10,321 and $10,619. Here, 317 addresses had previously purchased 1,500 YFI. Depending on the volume likely to be created while buyers rejoin the market, the crypto could penetrate this zone and maybe validate the anticipated rally to $13,500.
Looking at the other side of the fence
According to Santiment's network growth metric, which illustrates the number of new addresses joining the project daily, YFI is experiencing dwindling growth. Network growth tracks the user adoption over time and can help point out whether a crypto project is gaining momentum or not.
 [08.00.34, 04 Nov, 2020]-637400650084289421.png)
YFI network growth chart
In this case, the drop, as shown on the chart, suggests that YFI is losing ground and may not support future price growth, leaving $8,000 as a potential target for the bears.
Author

John Isige
FXStreet
John Isige is a seasoned cryptocurrency journalist and markets analyst committed to delivering high-quality, actionable insights tailored to traders, investors, and crypto enthusiasts. He enjoys deep dives into emerging Web3 tren


