Yearn.finance Price Prediction: YFI shows mild signs of recovery after 78% correction
- Whales holding YFI stream in as the decentralized finance token nears a potential bottom.
- A spike in daily active addresses points towards network growth and a possible recovery in the near term.

Yearn.finance has corrected a whopping 78% from its all-time highs of $44,000. Buyers tried to hold the decentralized finance (DeFi) token above $20,000 to no avail. The declines progressed to the extent YFI dived below Bitcoin's value, becoming the second most expensive cryptocurrency in the world.
On-chain metrics suggest YFI is bottoming
It is usual for a long-term downtrend to hit an elastic limit, giving into an uptrend. As for YFI, multiple on-chain metrics signal a potential bottom, with a high likelihood of a reversal occurring. According to Santiment, a leading provider of on-chain data, a spike in the daily active addresses is a crucial bullish indicator. These addresses shot up from near-zero on October 20 to 1,626 on October 30.
 [12.09.40, 30 Oct, 2020]-637396480019620533.png)
Yearn.finance daily active addresses chart
The transaction volume metric highlights an upswing in the number of transactions on the network on October 29. It is essential to keep in mind the transaction volume is not entirely a trend indicator but helps point out periods of incoming volatility. The metric can be used side-by-side with other on-chain and technical indicators.
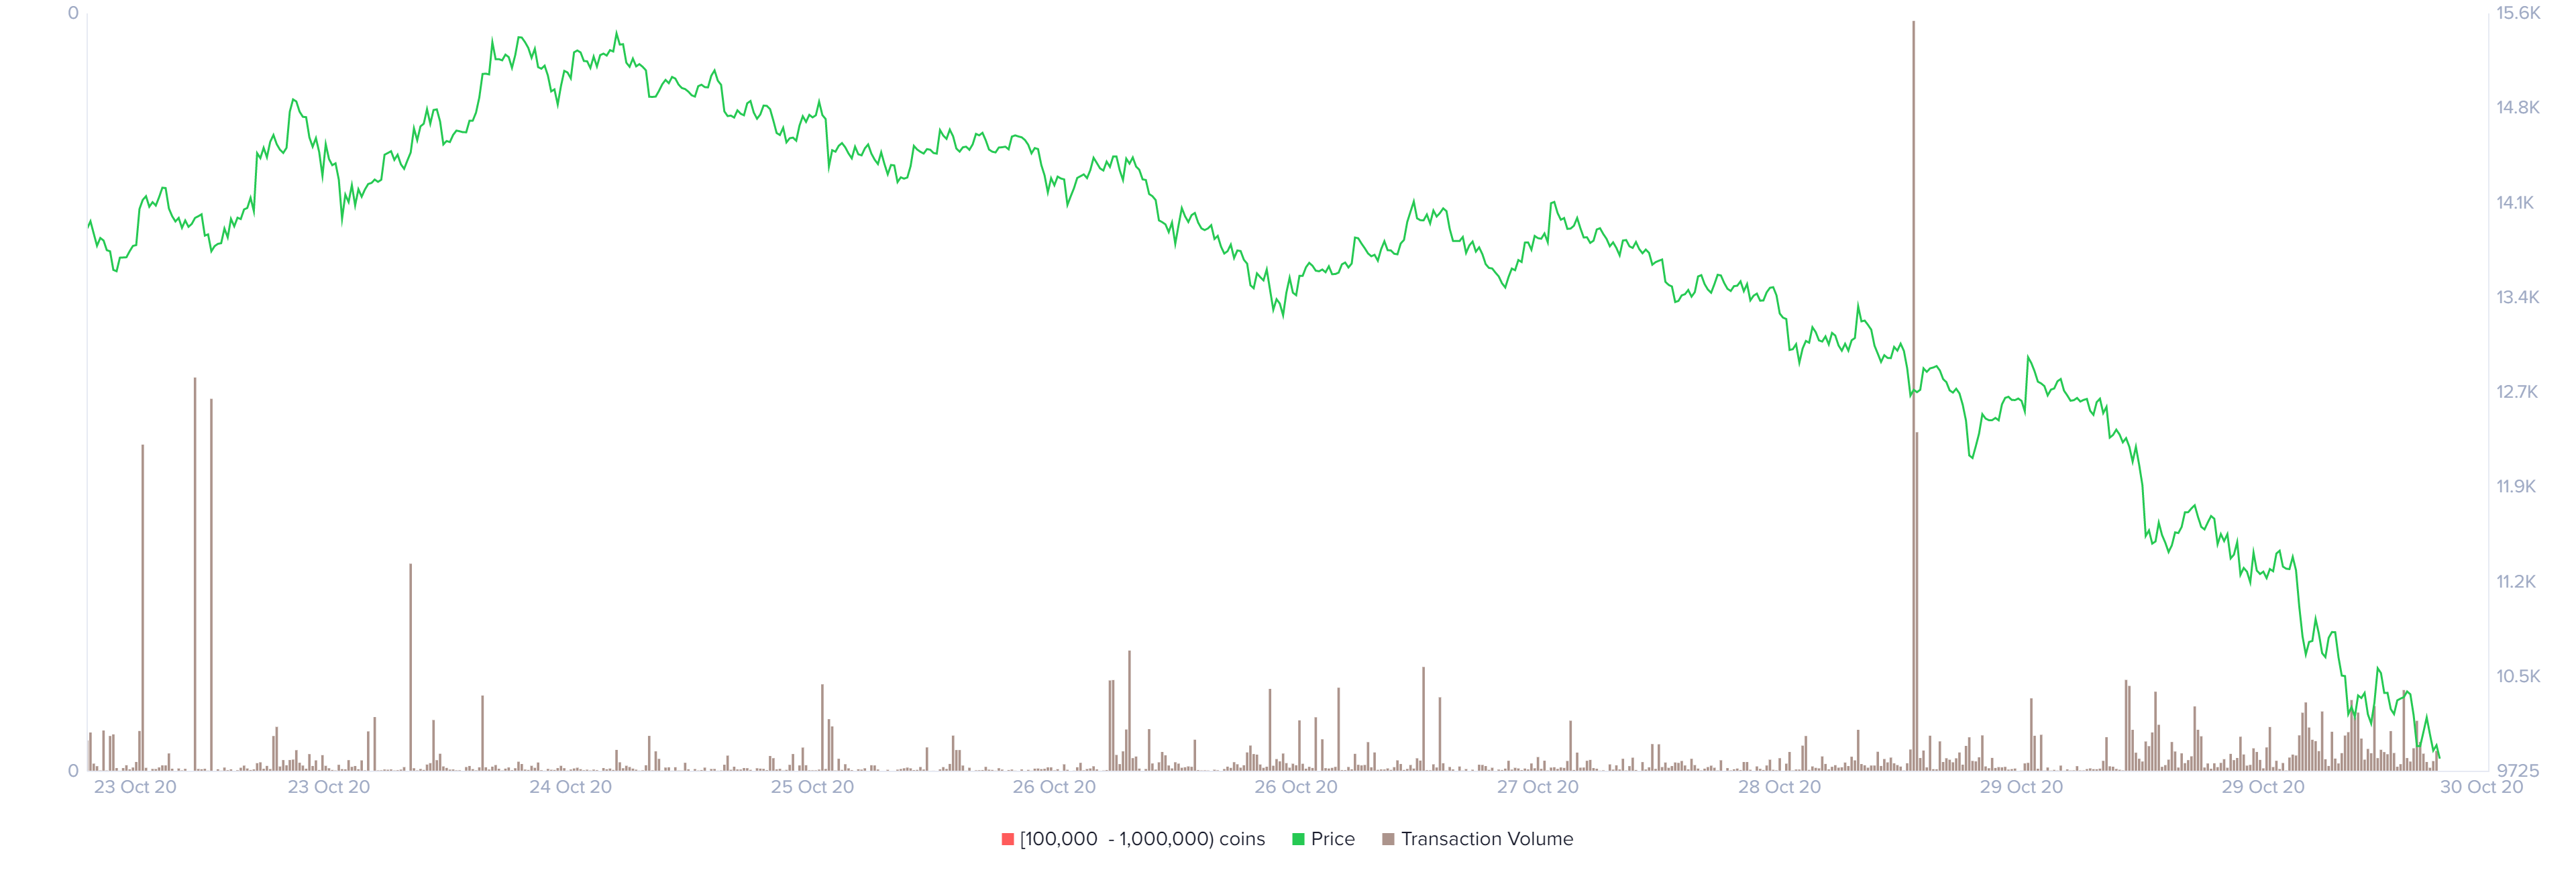
Yearn.finance transaction volume chart
Simultaneously, five whales holding between 1,000 and 10,000 YFI joined the network this week. The small entrance number of these large investors may seem insignificant, by their impact should not be underestimated, as they move a big volume of coins. If the addresses holding large amounts of YFI continue growing, a breakout in the price may soon come into play.
 [12.22.14, 30 Oct, 2020]-637396480788180928.png)
Yearn.finance holder distribution chart
The above on-chain metrics are a few that emphasize a possible reversal for YFI. According to Santiment, these bullish signs depict Ren's, which hit bottom sometime back and embarked on a recovery journey.
Looking at the other side of the picture
It is worth mentioning that technical levels present a contrary narrative to the one painted above. For instance, YFI/USD has dived below the middle boundary of a descending parallel channel, portraying an increasing seller grip.
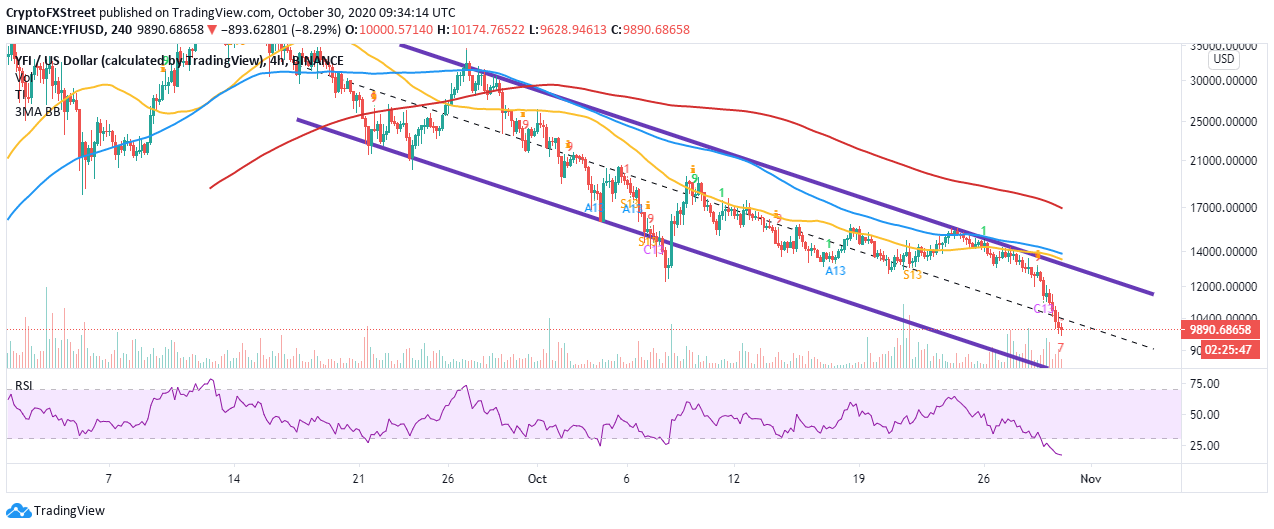
YFI/USD 4-hour chart
Simultaneously, the Relative Strength Index (RSI) suggests that bears have full control over the price. Therefore, YFI may incur some more losses before a bottom materializes to give way for recovery.
Author

John Isige
FXStreet
John Isige is a seasoned cryptocurrency journalist and markets analyst committed to delivering high-quality, actionable insights tailored to traders, investors, and crypto enthusiasts. He enjoys deep dives into emerging Web3 tren


