Yearn.Finance Price Analysis: YFI’s uptrend weakens as several sell signals emerge
- Yearn.Finance seems to be abandoning the uptrend as technical levels deplete.
- On-chain metrics add credibility to the bearish picture suggesting that YFI/USD might fall to $22,500.

Yearn.Finance looks ready to dump some more despite the retreat from the recent high at $32,000. The uptrend within an ascending parallel channel on the 4-hour chart is weakening. On the downside, the decentralized finance (DeFi) token has eyes on $22,500.
Yearn.Finance nurtures another breakdown
The most expensive cryptocurrency is trading at $25,600 at the time of writing. The 50 Simple Moving Average limits price movements immediately on the upside. Further up, the 100 SMA adds overhead pressure on YFI/USD.
The channel’s lower boundary must be guarded at all costs; otherwise, losses might continue to the next support at the 200 SMA ($22,500). Moreover, the bearish outlook will be validated if YFI closes the day under the 50 SMA.
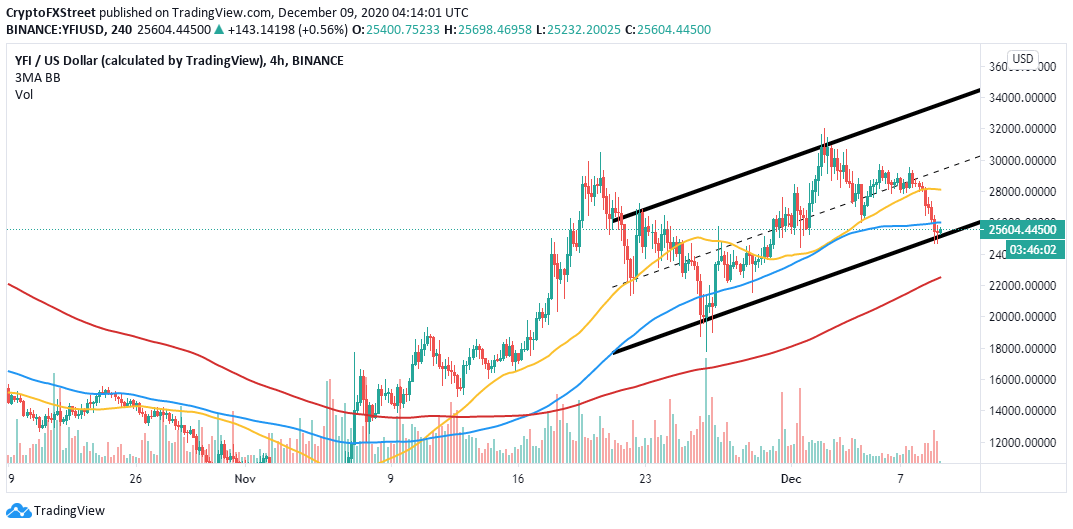
YFI/USD 4-hour chart
The 12-hour chart adds credibility to the bearish outlook after the parabolic SAR points flipped bearishly. Yearn.Finance is likely to continue exploring the downstream until the SAR points turn back bullish.
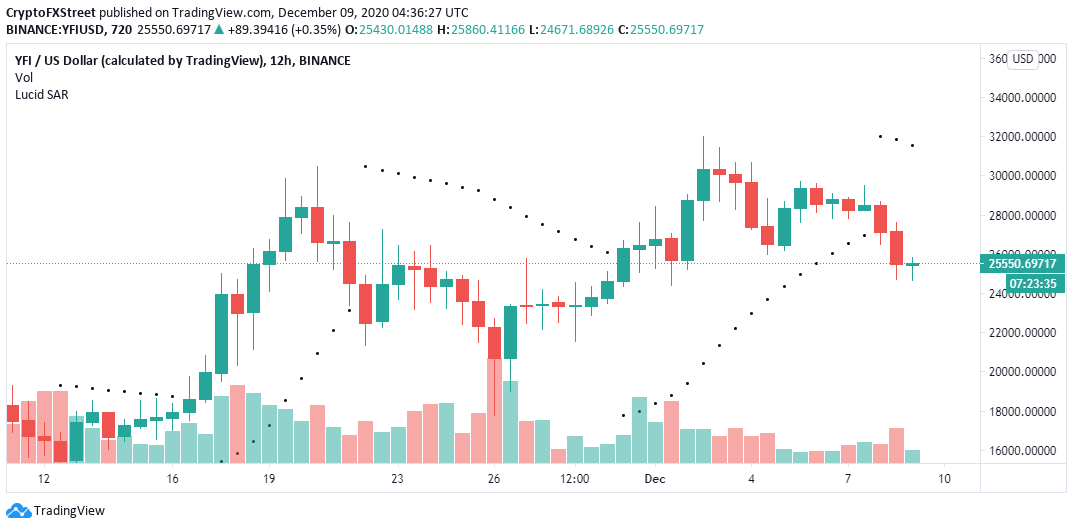
YFI/USD 12-hour chart
IntoTheBlock’s IOMAP “Daily New Addresses” metric reveals a declining network growth. The dwindling on-chain picture results from a drop in the number of new addresses joining the network.
For instance, the newly created addresses topped 935 on December 2 but had plunged to 357 on December 8. The decline is a bearish signal for the token as well as the project’s future adoption.
-637430865876284048.png)
Yearn.Finance network growth
The IOMAP model reveals that YFI is sitting under a challenging resistance zone from $25,510 to $26,276, likely to hamper recovery. Another robust resistance lies between $27,808 and $28,574.
-637430867756196598.png)
Yearn.Finance IOMAP chart
On the downside, the model shows that Yearn.Finance has the leeway to explore the downside even more until it hits the critical support at $23,170 to $23,936. Here, roughly 1,400 addresses previously bought approximately 2,400 YFI.
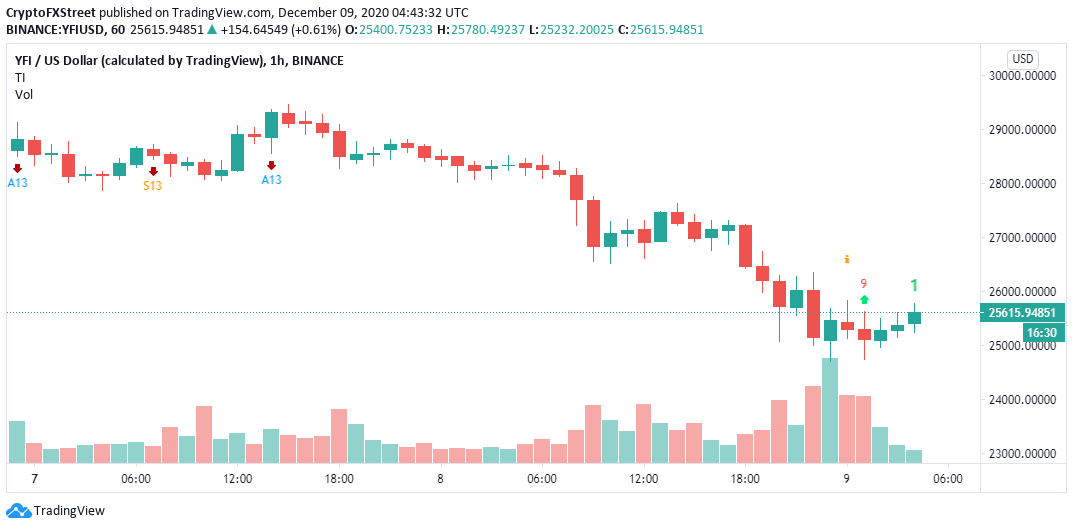
YFI/USD 1-hour chart
The TD Sequential indicator recently presented a buy signal on the 1-hour chart. The signal manifested in a red nine candlestick.
A bullish formation seems to be forming on the chart and if the signal is validated, Yearn.Finance may rally in one to four candlesticks. An increase in the demand for YFI will invalidate the downtrend and favor a recovery towards $30,000.
Author

John Isige
FXStreet
John Isige is a seasoned cryptocurrency journalist and markets analyst committed to delivering high-quality, actionable insights tailored to traders, investors, and crypto enthusiasts. He enjoys deep dives into emerging Web3 tren



