|

XRP/USD is trapped in consolidation

ipple – XRPUSD is bearish for the last year, but looking at the daily chart, we see an A-B-C corrective decline from April 2021 highs. It’s actually already trading in final stages of wave C and it can be slowly approaching the end. Wave C is a motive wave and it should be completed by a five-wave cycle of the lower degree, but looks like final subwave of 5 of C is still missing.
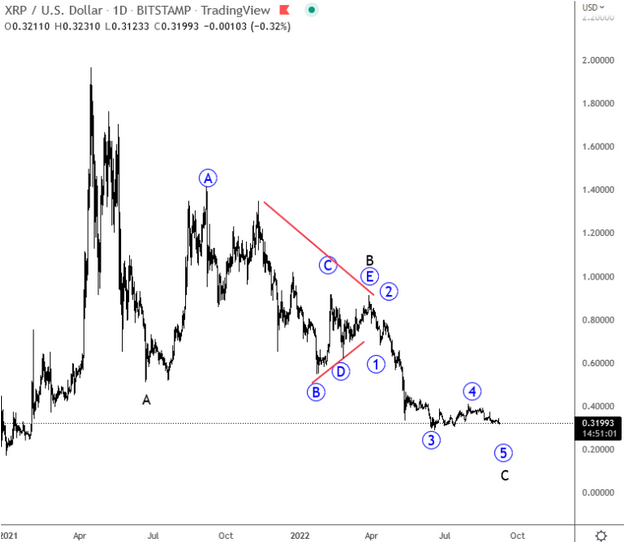
Chart

XRP/USD Daily Chart

Looking at the 4-hour chart, we can see a sideways corrective structure which indicates for a bearish running triangle pattern within wave 4, but we may see some rally as final subwave (E) may still occur. So, once a triangle is fully completed, watch out for a continuation lower within final 5th wave of C. If from any reason we see a strong bounce back above 0.5 then bulls can be back, especially if rise would be in five waves.
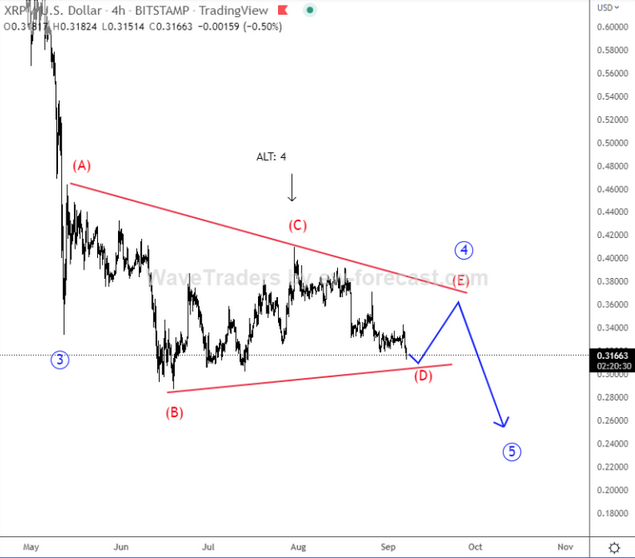
Chart

XRPUSD 4-hour Chart

What is a triangle?

Corrective pattern with converging trendlines, subdividing 3-3-3-3-3 and labeled A-B-C-D-E. Occurs in wave 4, B, X or Y wave.

How to trade it?

Option 1: Small position size on projection for wave »e«, with stops beyond wave »a«. Trail stops when »b-d« triangle line is broken, and add to your position. Trail stops to latest entry when market breaks to new highs/lows

Option 2: Normal position size when wave »b« is broken, with stops beyond wave »e«. Pull stops to entry when market breaks to new highs/lows.


Get Full Access To Our Premium Analysis For 14 Days. Click here!


Get Full Access To Our Premium Elliott Wave Analysis For 14 Days. Click here.

Author

Gregor Horvat

Gregor Horvat

Wavetraders

Experience Grega is based in Slovenia and has been in the Forex market since 2003.

More from Gregor Horvat
Share:

Editor's Picks

XRP rally extends as modest ETF inflows support recovery

Ripple is accelerating its recovery, trading above $1.36 at the time of writing on Friday, as investors adjust their positions following a turbulent week in the broader crypto market. The remittance token is up over 21% from its intraday low of $1.12.

Crypto Today: Bitcoin, Ethereum, XRP rebound amid risk-off, $2.6 billion liquidation wave

Bitcoin rebounds after testing an intraday low at $60,000 amid persistent retail investor exit. Ethereum shows subtle signs of recovery, but ETFs outflows limit upside. XRP gains by over 10% on Friday amid mild ETF inflows and a drop in futures Open Interest to $2.40 billion.

Bitcoin Weekly Forecast: The worst may be behind us

Bitcoin price recovers slightly, trading at $65,000 at the time of writing on Friday, after reaching a low of $60,000 during the early Asian trading session. The Crypto King remained under pressure so far this week, posting three consecutive weeks of losses exceeding 30%. 

Pi Network hits record low despite plans to deploy KYC validator rewards in March

Pi Network hovers above $0.1400 on Friday, up from the $0.1300 record low seen earlier in the day. The sell-off continues even as Pi Network has announced that it will distribute KYC validator rewards by the end of March.

Bitcoin Price Annual Forecast: BTC holds long-term bullish structure heading into 2026

Bitcoin (BTC) is wrapping up 2025 as one of its most eventful years, defined by unprecedented institutional participation, major regulatory developments, and extreme price volatility.

Bitcoin: The worst may be behind us

Bitcoin (BTC) price recovers slightly, trading at $65,000 at the time of writing on Friday, after reaching a low of $60,000 during the early Asian trading session. The Crypto King remained under pressure so far this week, posting three consecutive weeks of losses exceeding 30%.