Top 3 meme coins price prediction Dogecoin, Shiba Inu and Bonk: Memes wipe out gains from GameStop rally
- Dogecoin adds nearly 1% to its value on Tuesday, over 76% wallets are sitting on unrealized gains.
- Shiba Inu could sweep liquidity at $0.00002213 as SHIB price forms a descending triangle on daily timeframe.
- Bonk eyes nearly 10% decline as it trades sideways on Tuesday.
Meme coins Dogecoin (DOGE), Shiba Inu (SHIB), and Bonk (BONK) rallied alongside top meme tokens in response to GameStop’s rally on Monday. As legendary trader “Roaring Kitty” resurfaced on X with a series of tweets, meme tokens rallied, piling gains on Monday.
In the 24 hour timeframe, DOGE, SHIB and BONK prices climbed 4%, 0.5%, 1.3% as seen on CoinGecko. On the daily timeframe the prices of the meme coins noted at the most 1% gains.
Dogecoin wipes out gains from GameStop inspired rally
DOGE climbed to a high of $0.1576 on Monday, rallying alongside meme coins. The gains were likely catalyzed by the trader “Roaring Kitty” return to X for the first time in three years. DOGE wiped out its gains and the meme coin is trading at $0.1490 on Binance, at the time of writing.
Dogecoin faces resistance at $0.1616, the 61.8% Fibonacci retracement level of its decline from the March 28 peak of $0.2288 to the May 1 low of $0.1201. The Moving Average Convergence Divergence (MACD) indicator reveals underlying negative momentum in DOGE price trend in the 1-week timeframe.
The DOGE/USDT 1-day chart shows Relative Strength Index (RSI) making its way to 50, the neutral level. At the time of writing, RSI is 48.41. DOGE price is likely to test resistance at $0.1616, nearly 8.45% away from the current level. MACD indicator shows a bullish sign with MACD crossing above the signal line.
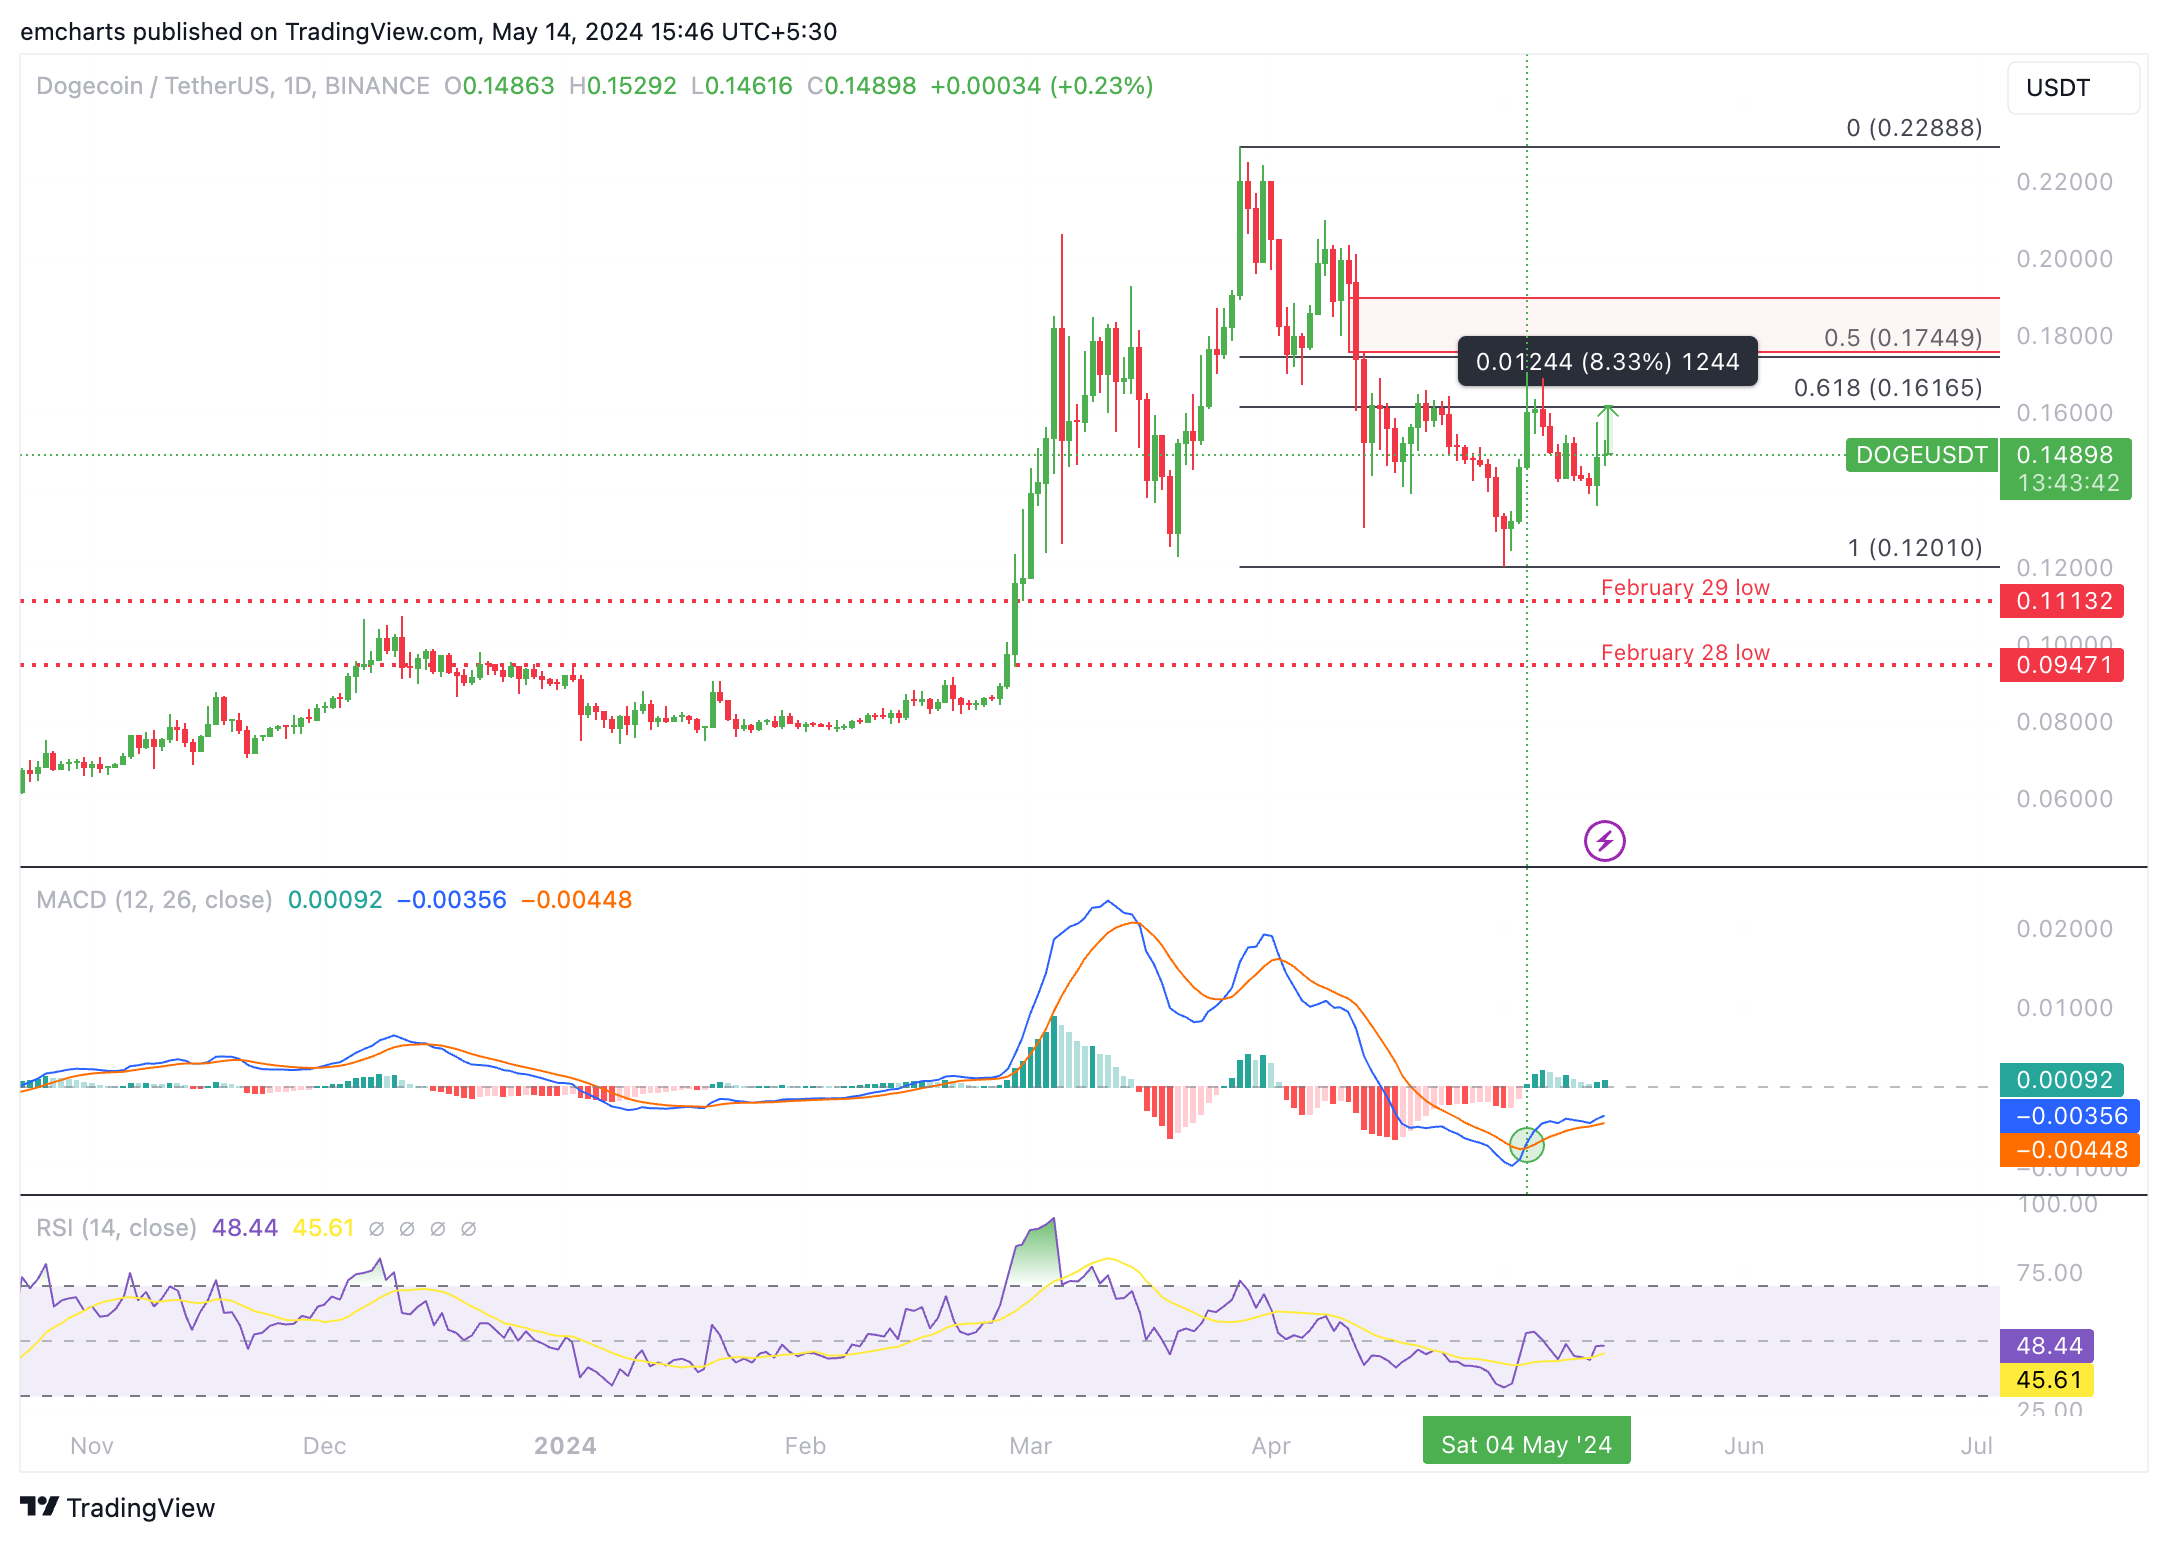
DOGE/USDT 1-day chart
Looking down, DOGE could sweep liquidity at the May 3 low of $0.1311 in the case of a correction.
Data from IntoTheBlock shows that 76% of wallets holding DOGE are currently sitting on unrealized profits. The Global In/Out of Money (GIOM) indicator helps identify key support/ resistance levels for an asset. The indicator shows that DOGE faces resistance at $0.1526, on its path to $0.1616.
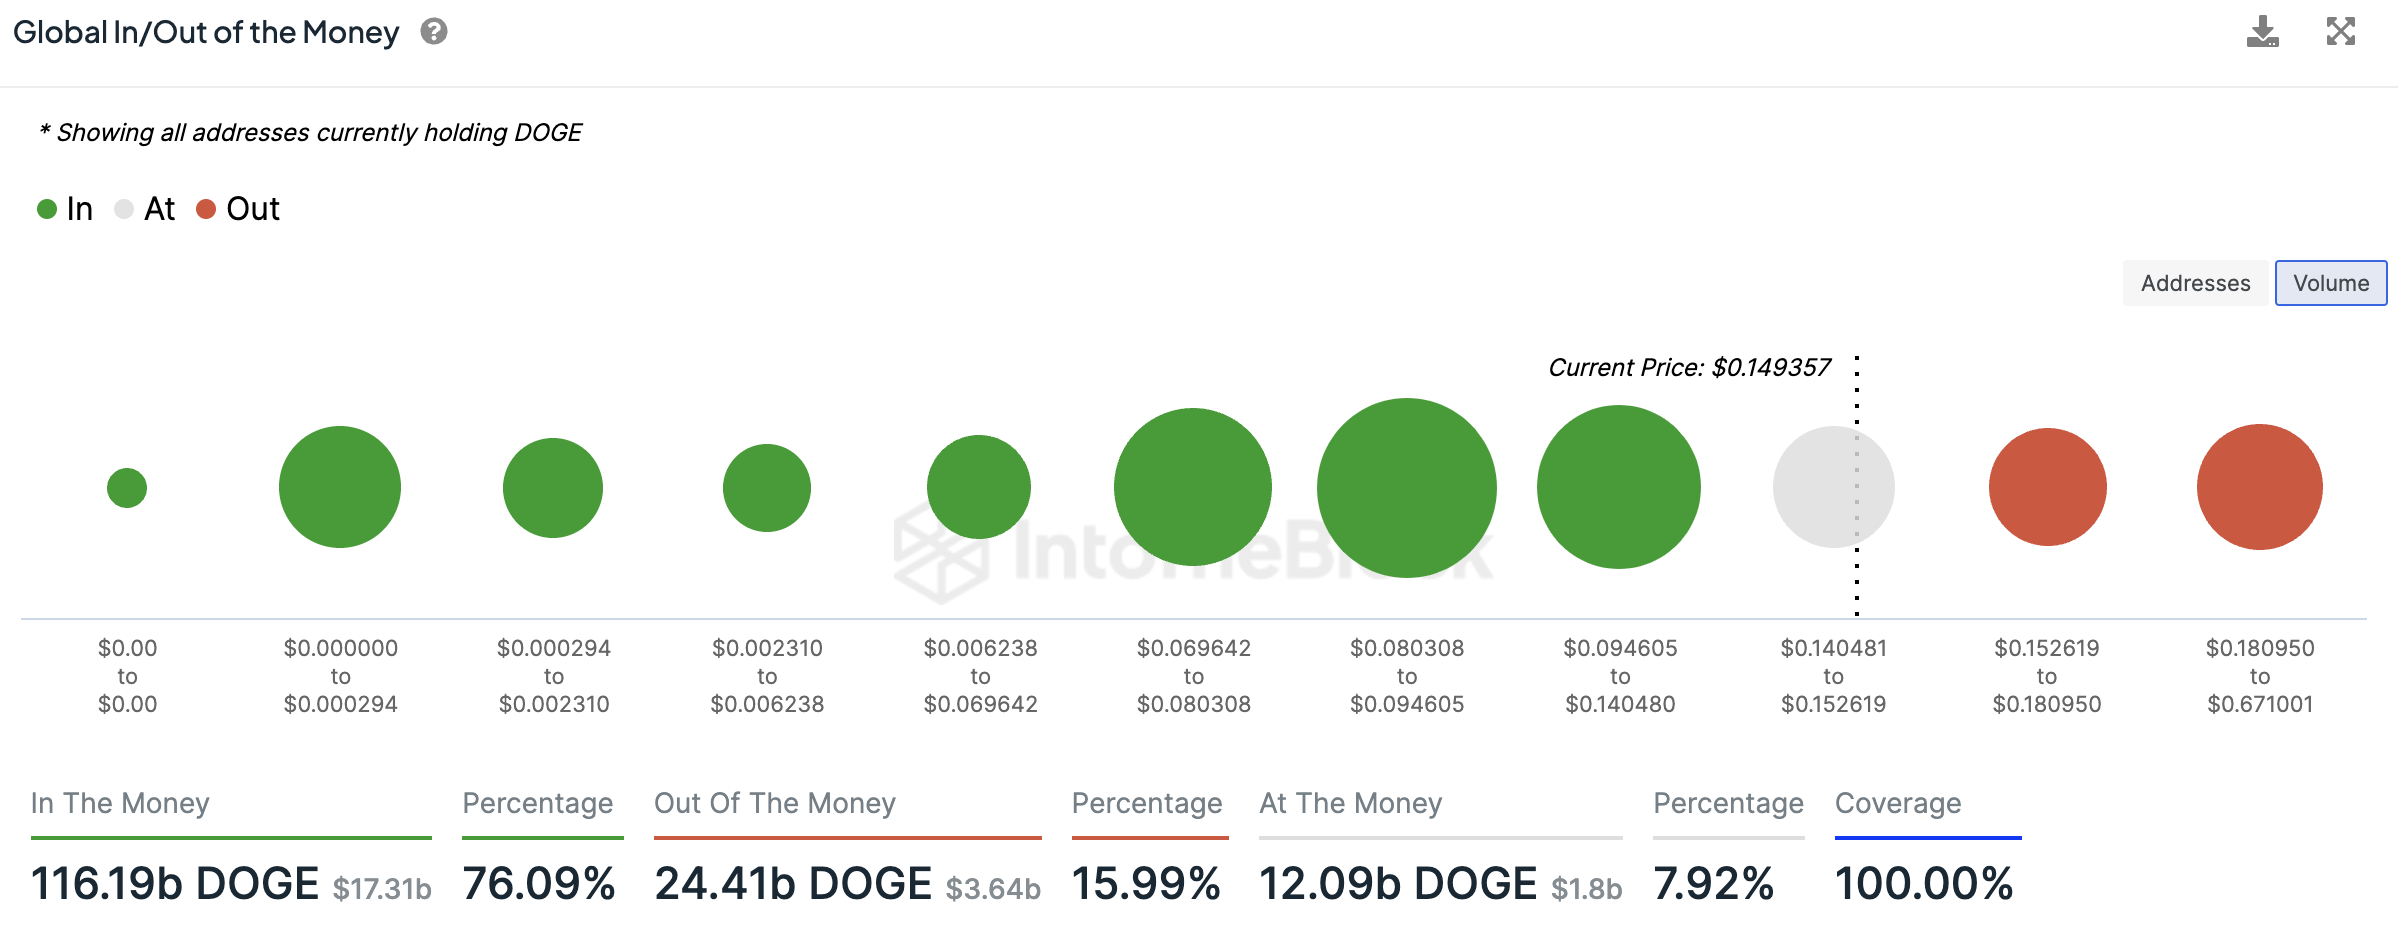
DOGE Global In/Out of the Money
Shiba Inu is stuck in a descending triangle pattern
The daily chart shows that SHIB price trades in a descending triangle, a bearish chart pattern, since March 5 Shiba Inu attempts to break above the upper boundary of the pattern at $0.00002338 on Tuesday, however, a decisive close outside the descending trend-line is needed to confirm a break from the descending triangle.
Typically, this chart pattern suggests that the demand for SHIB is weakening.
SHIB is likely to sweep liquidity at $0.00002213, the lower boundary of the descending triangle. This could mark over 6% decline from the current price level.
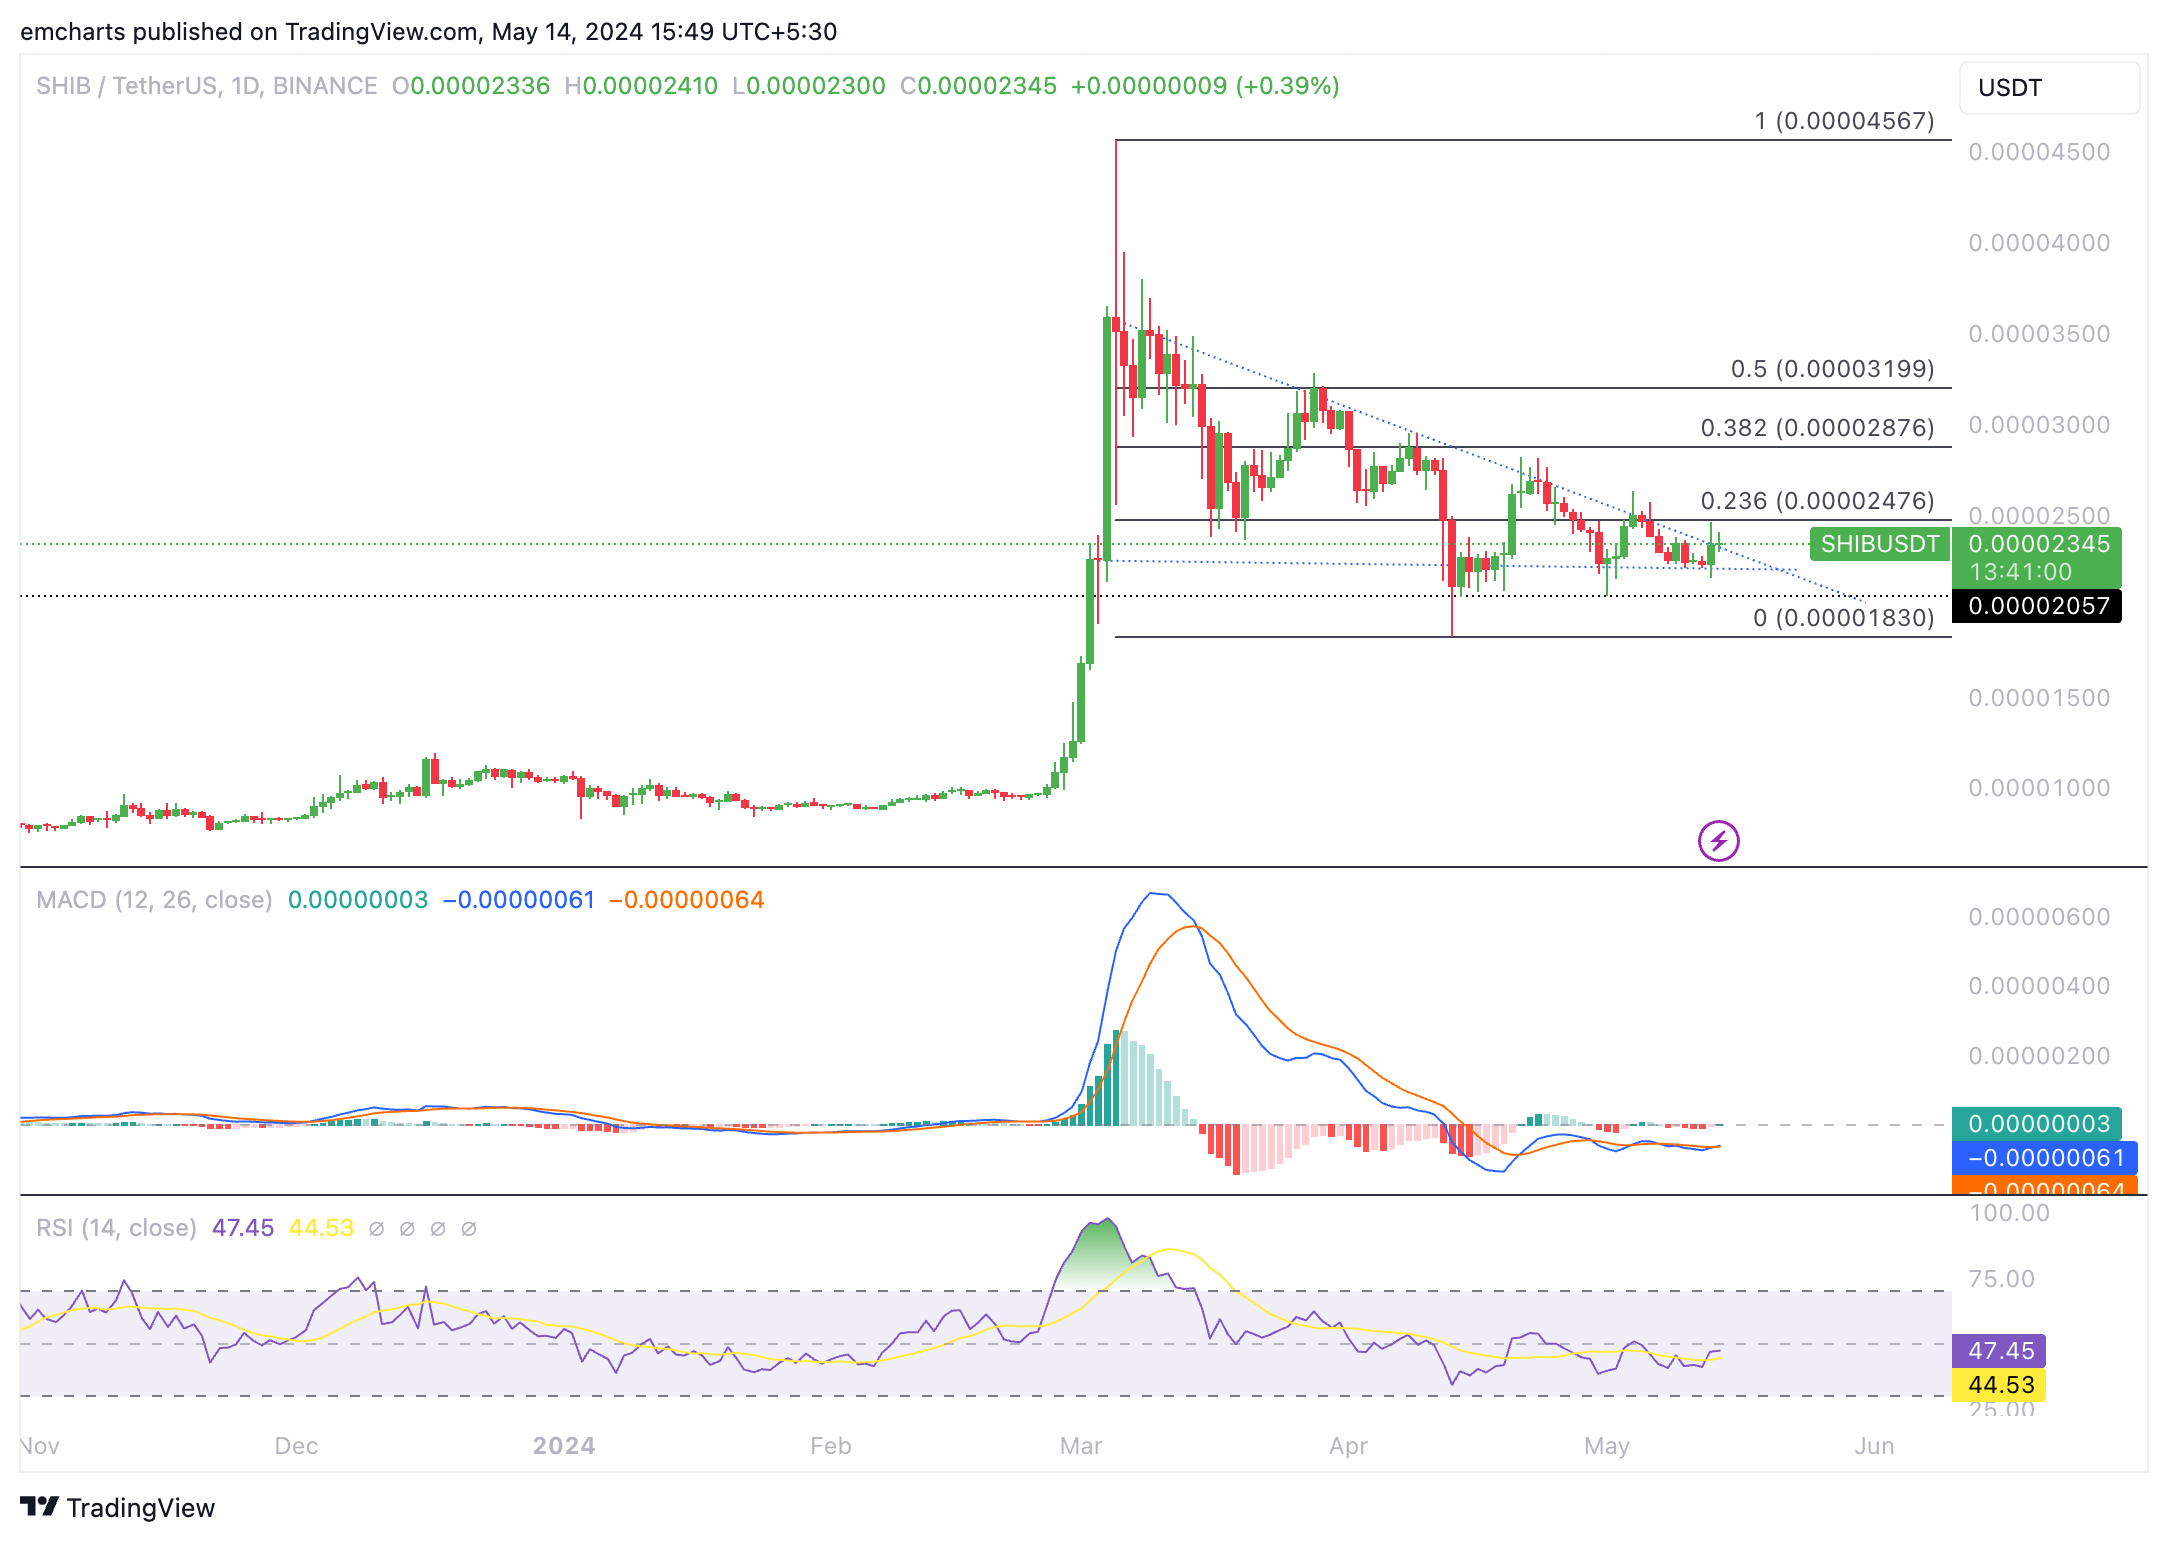
SHIB/USDT 1-day chart
If SHIB closes above $0.00002338, it could test resistance at $0.00002476, the 23.6% Fibonacci retracement of the decline between the March 5 top of $0.00004567 and the April 13 bottom of $0.00001830.
Bonk could plummet 10%
BONK trades at $0.00002339 on Tuesday. On the daily and 4-hour timeframe, BONK’s price trend has an underlying negative momentum. BONK could sweep liquidity 10% below the current price at $0.00002089, the 50% Fibonacci retracement of the climb from the April 13 low of $0.00001212 to the April 25 top of $0.00002966.
On its way down, BONK could find intermediate support at the May 13 low of $0.00002144.
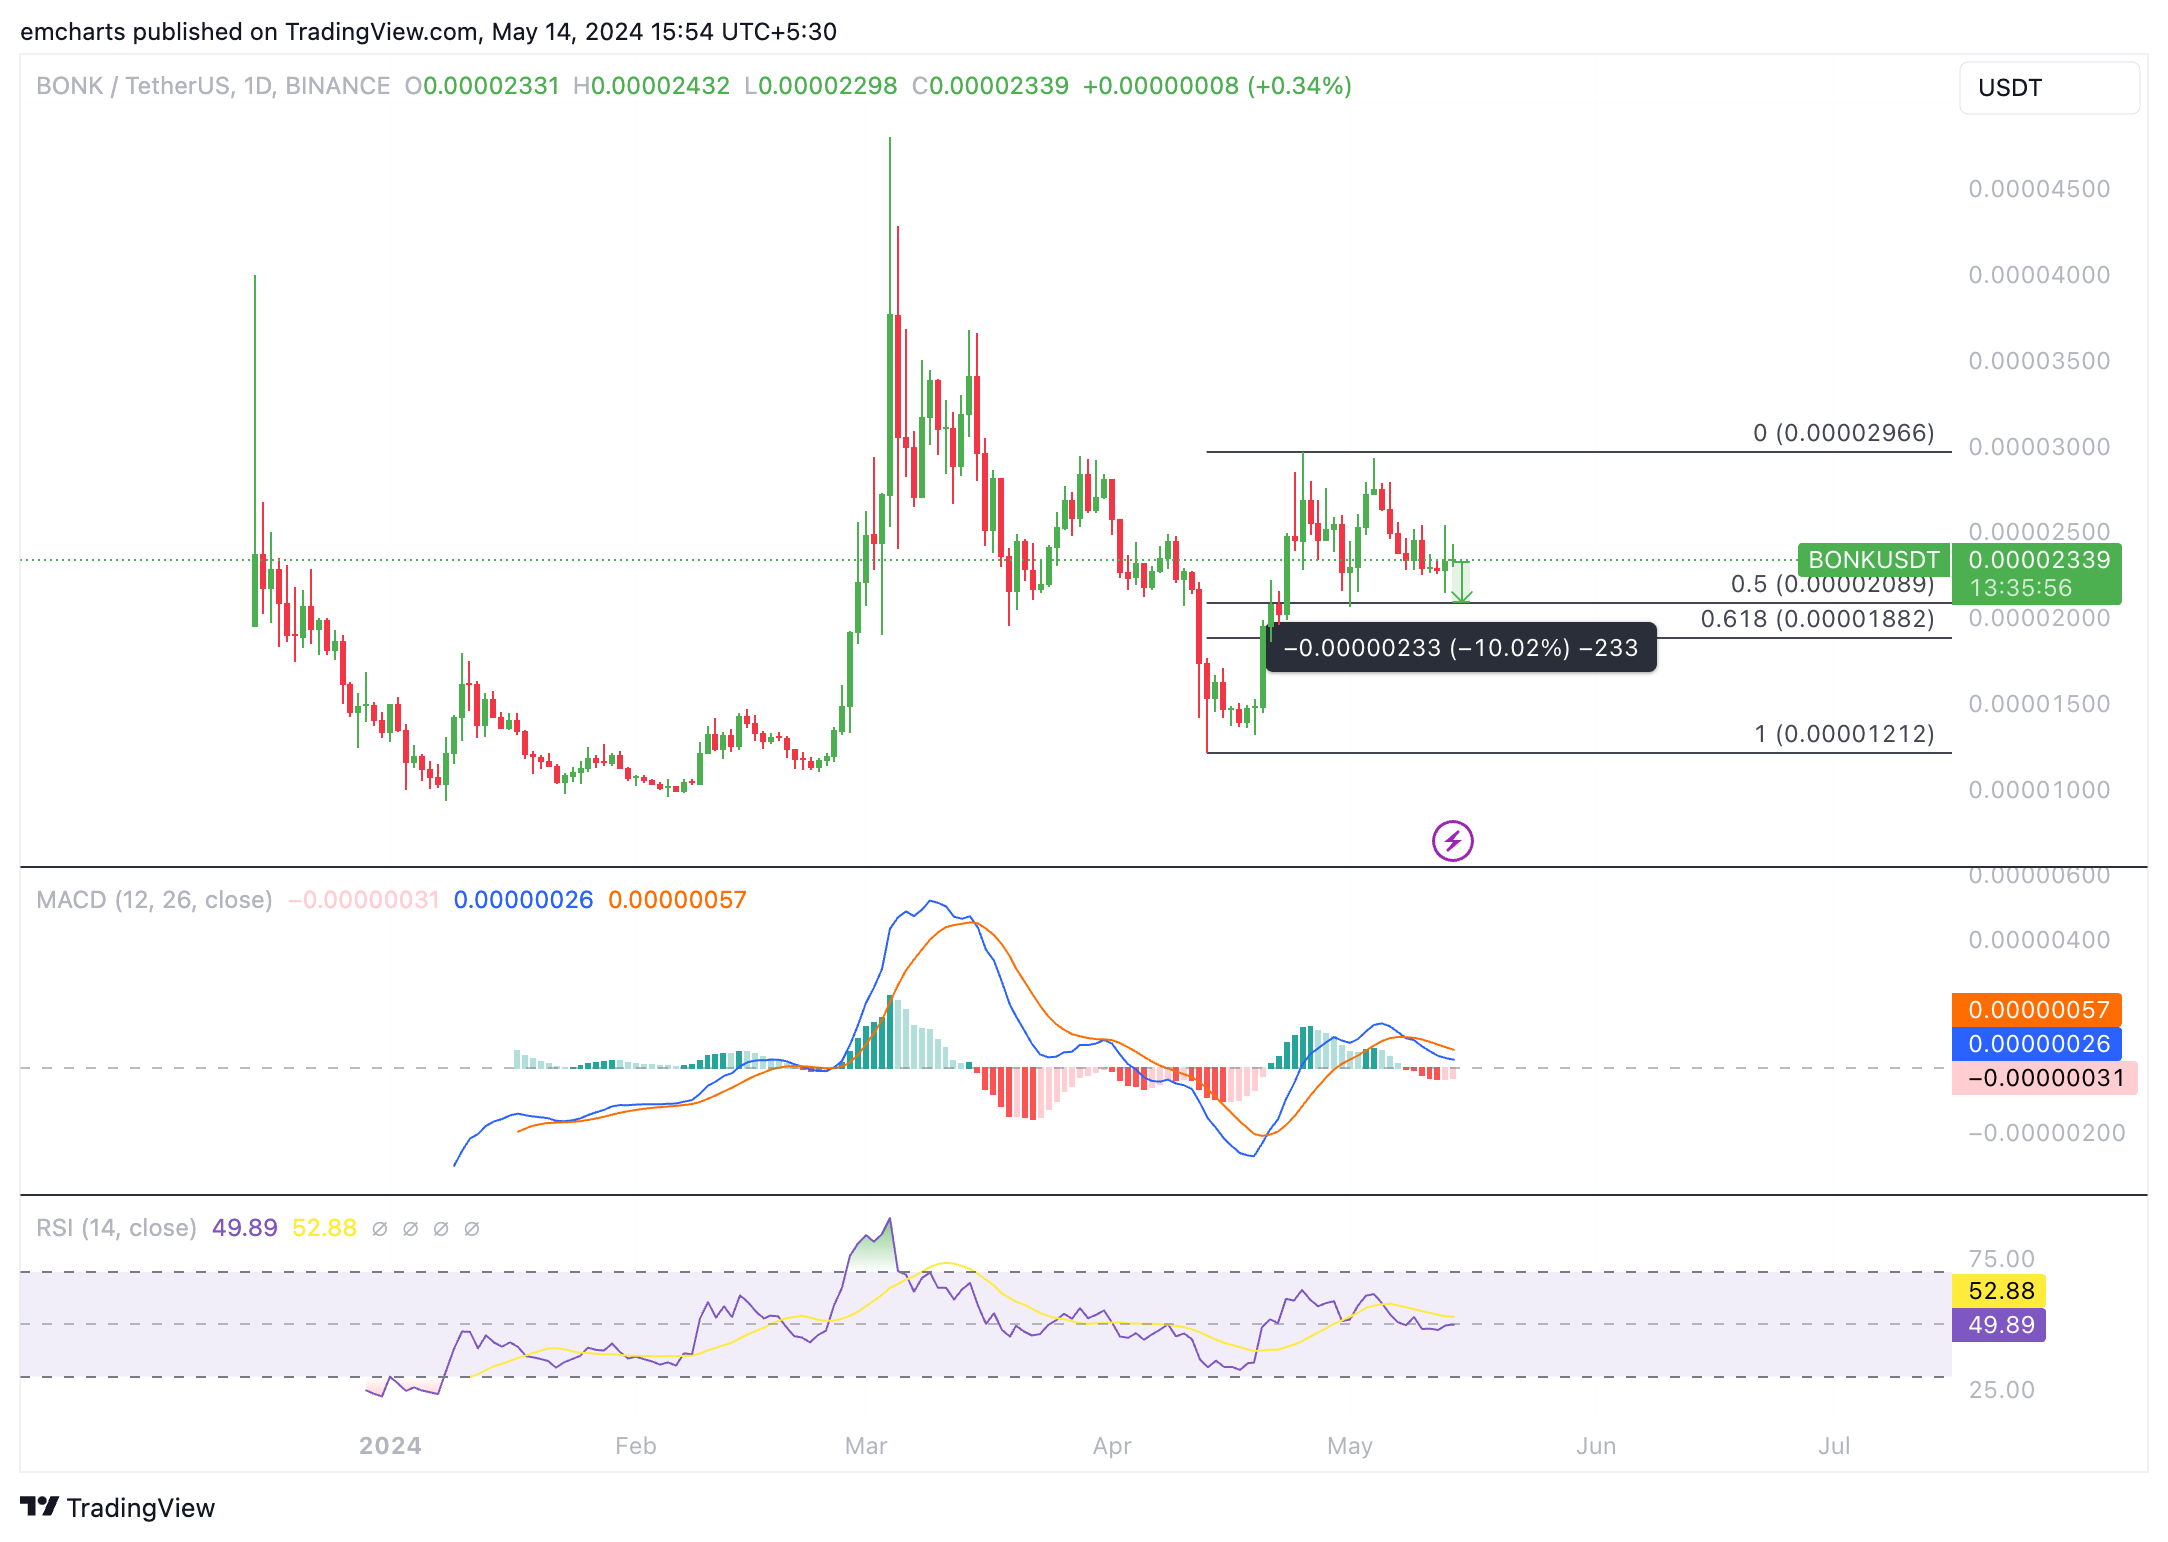
BONK/USDT 1-day chart
On the upside, BONK could test resistance at the May 13 high of $0.00002542, just below the resistance at $0.00002552, the 23.6% Fibonacci retracement of the climb between April 13 and April 25.
Author

Ekta Mourya
FXStreet
Ekta Mourya has extensive experience in fundamental and on-chain analysis, particularly focused on impact of macroeconomics and central bank policies on cryptocurrencies.


