XRP trading volume soared to $4.4 billion in Q2, recording 98% increase from last quarter
- XRP has seen a massive climb in trading volume in the second quarter this year.
- The cross-border remittance token recorded four days in Q2 with the highest trading volume in its entire history.
- The volatility of XRP was considerably higher than that of Bitcoin and Ethereum during this period.

The latest Ripple quarterly report revealed that the cross-border remittance token witnessed a surge in trading volume in the second quarter of this year.
XRP Q2 volume almost doubled last quarter
XRP, the sixth-largest cryptocurrency by market capitalization, recorded a massive spike in trading volume in Q2 this year, climbing to over $4.4 billion. Comparatively, its trading volume in Q1 was $2.2 billion, a 98% increase in the second quarter.
The volume of XRP has seen four days in the second quarter, of which it set the four highest volume days ever recorded in its entire history.
The Ripple quarterly report also stated that three billion XRP were released out of escrow, averaging one billion a month in line with the previous quarters and the official escrow arrangement.
Ripple further recorded the milestones that it has made in the lawsuit filed by the United States Securities & Exchange Commission (SEC), including the fact that the blockchain firm was entitled to certain internal documents from the regulator.
XRP price could pull back before another leg up
XRP price was off to a great start at the beginning of Q2, recording nearly a 240% surge in less than two weeks in April. However, the rally did not last, and the cross-border remittance token is down by roughly 62% from its April high.
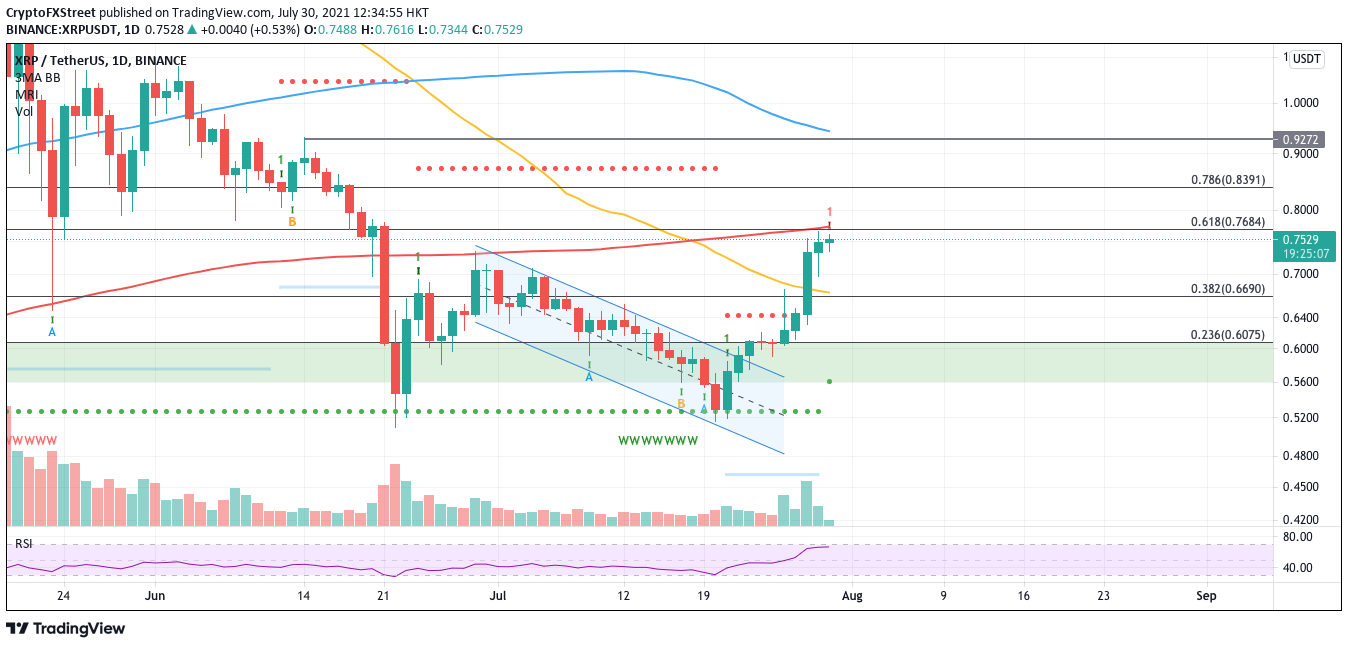
XRP price has climbed nearly 33% in the past week, breaking through the 50-day Simple Moving Average (SMA) on the daily chart, which acted as stiff resistance for Ripple since May 19.
The spike in buying pressure allowed XRP price to surge through the 38.2% Fibonacci extension level and to tag the 61.8% Fibonacci extension level.
XRP/USDT daily chart
However, Ripple is faced with a tough hurdle at the 200-day SMA, as the Momentum Reversal Indicator (MRI) flashed an MRI top signal, suggesting that XRP price may have set its local top.
XRP price failed to slice above the 61.8% Fibonacci extension level and the 200-day SMA at $0.76, which could see Ripple retest critical levels of support before eyeing a higher target.
The first line of defense is at the 50-day SMA and the 38.2% Fibonacci extension level at $0.66. Should further selling pressure arise, XRP price could fall into the demand zone that extends from $0.55 to $0.60 – the latter coinciding with the 23.6% Fibonacci extension level.
Author

Sarah Tran
Independent Analyst
Sarah has closely followed the growth of blockchain technology and its adoption since 2016.