XRP Price Prediction: Ripple bulldozes resistance, eyes $1.00
- XRP price bounces over 38% over eight days, taking the altcoin close to the 200-day simple moving average (SMA).
- Daily volume profile improving with two positive days on above-average volume.
- Ripple falls short of triggering a double bottom pattern.

XRP price rebound has taken on an impulsive tone, lifting the cross-border remittances token near the convergence of the 200-day SMA with the longstanding inverse head-and-shoulders neckline around $0.775. The newfound commitment has raised the odds of a successful breakout moving forward and a rush to the psychologically important $1.00.
XRP price has one more step to go in the bottoming process
Contrary to initial forecasts, XRP price has quickly overcome multiple layers of resistance during this rebound from an oversold condition on the daily Relative Strength Index (RSI). The first layer was the May descending trend line, followed by the critical May 23 low of $0.652, a point of resistance in mid-July and fortified by weekly highs in February and December 2020 around the same price. Finally, Ripple closed above the 50-day SMA at $0.680 yesterday with the best daily gain since June 23.
The strength of the XRP rally now has the digital token carrying a weekly gain of almost 18%, marking the best weekly return since the end of April and comes off a successful test of the 50-week SMA last week. Moreover, on a monthly basis, Ripple is now flat for July after being down 27% at the July 20 low.
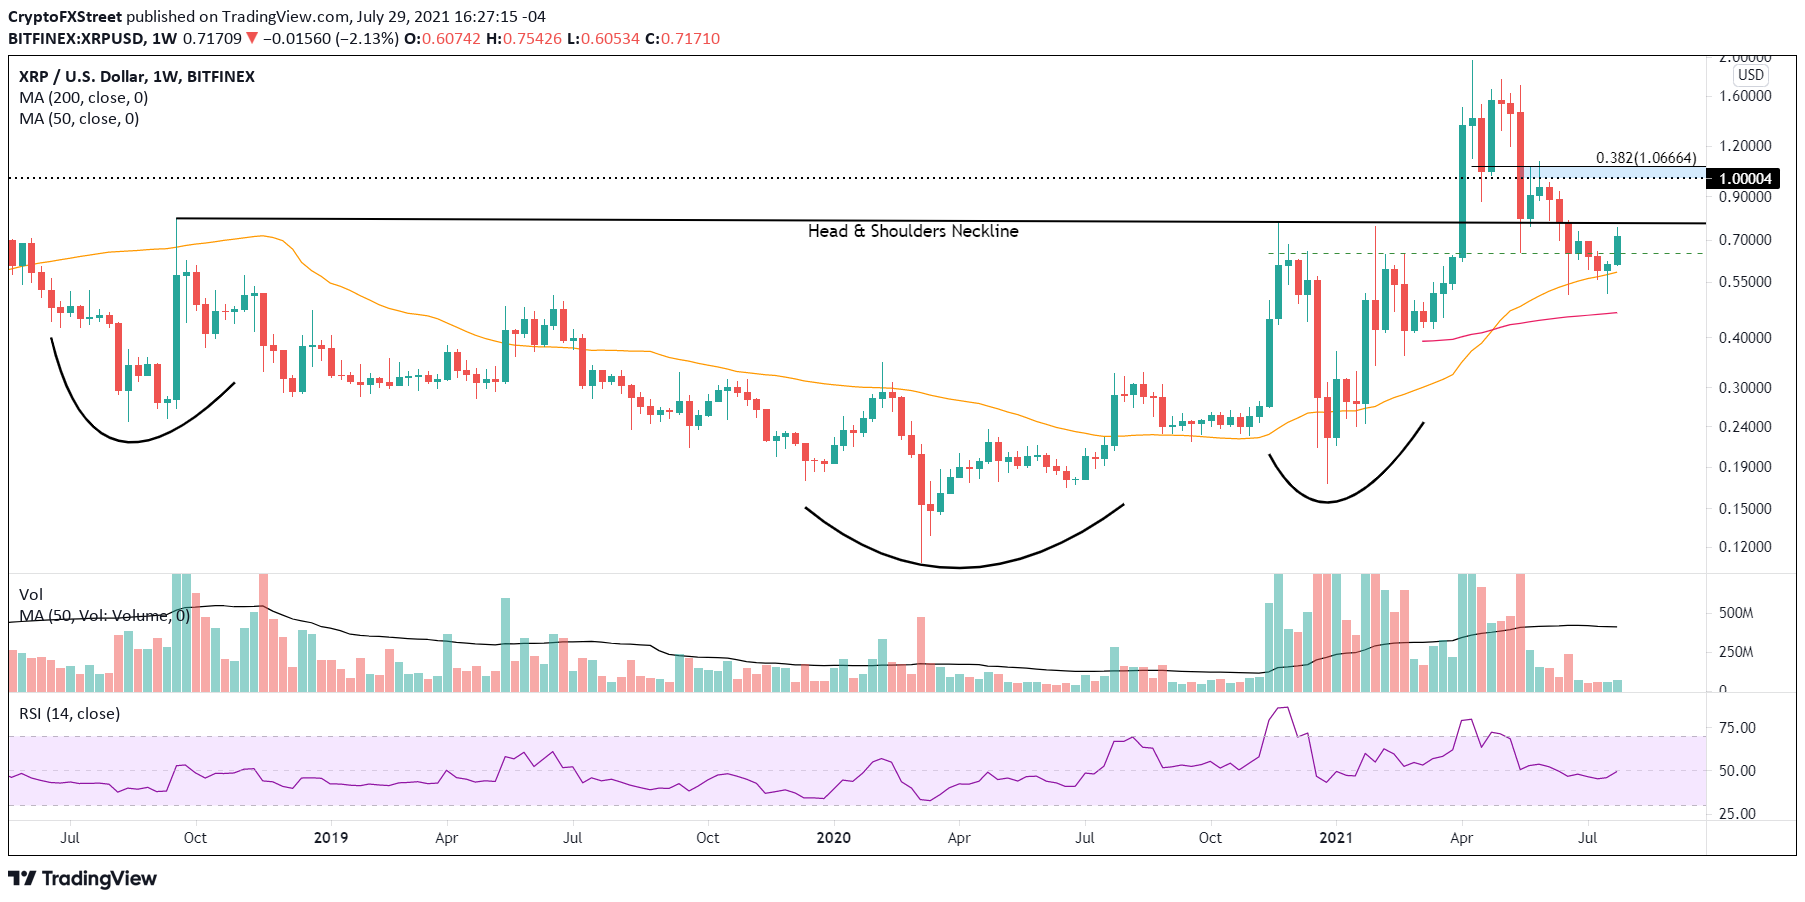
XRP/USD weekly chart
What’s next? XRP price needs to trigger the double bottom pattern with a daily close above $0.733 and then log a close above the confluence of the 200-day SMA with the neckline of the inverse head-and-shoulders pattern at $0.775. If successful, XRP price is free to test $1.00 and potentially the 38.2% Fibonacci retracement of the April-June correction at $1.06, which aligns with some price congestion in late May and early June. An advance from $0.775 to the Fibonacci retracement level represents a 38% return for Ripple.
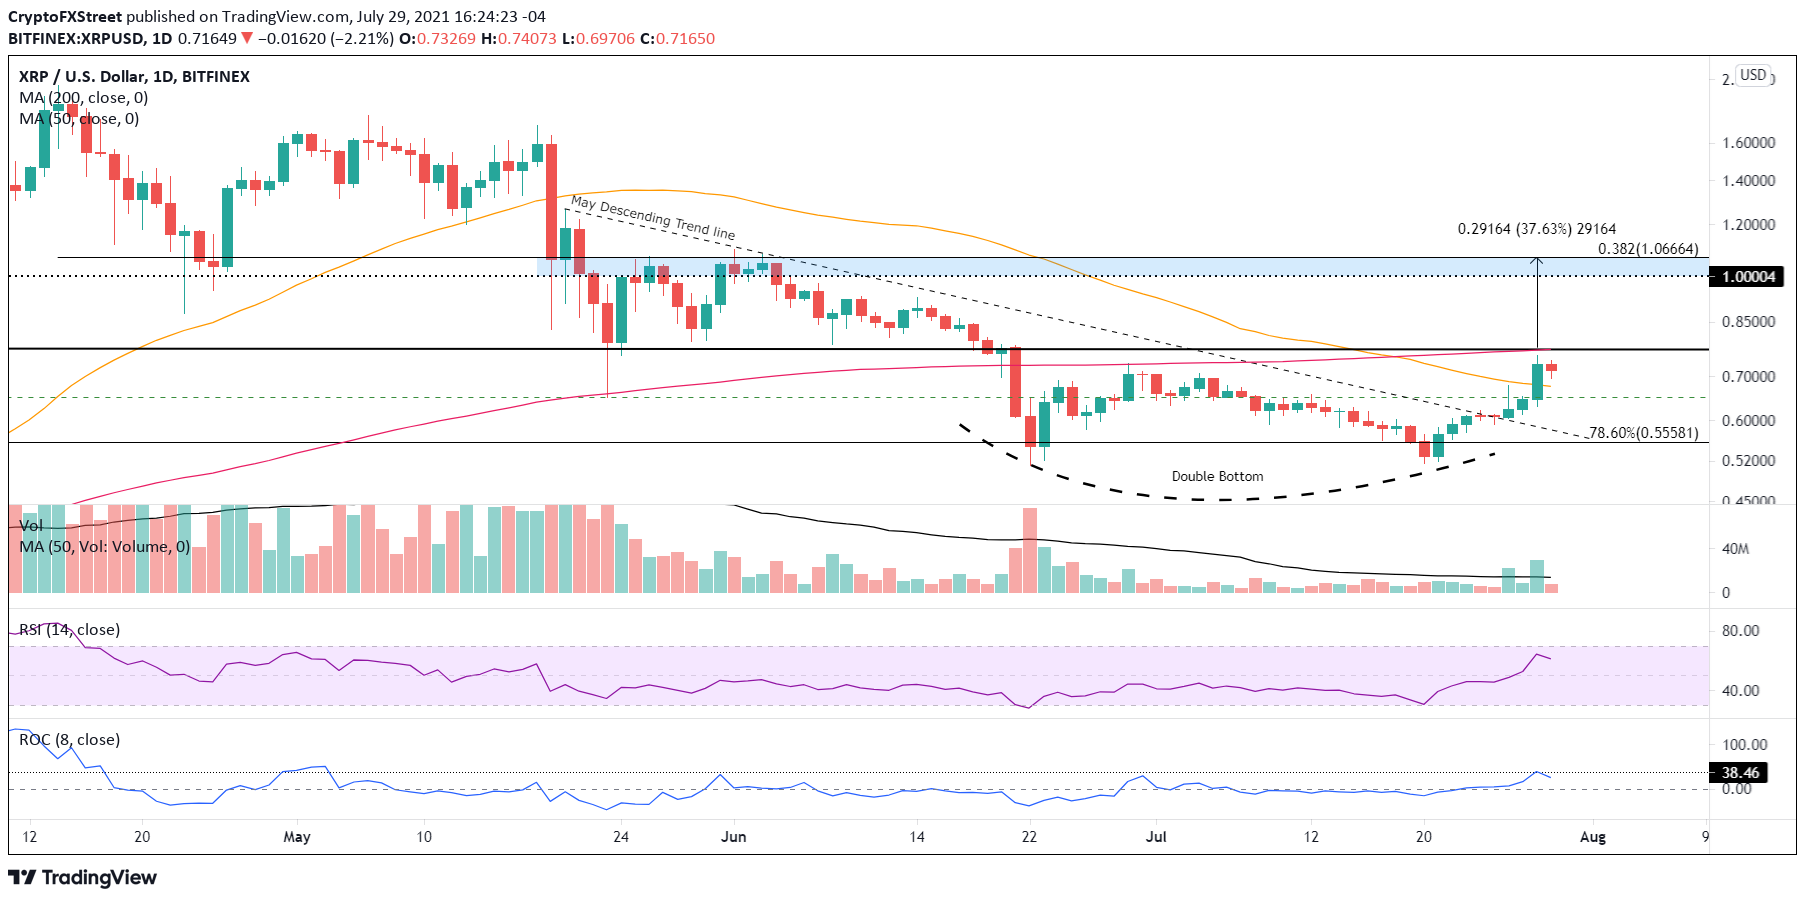
XRP/USD daily chart
With several layers of resistance beat, they become support for any XRP price weakness. To be sure, the 50-day SMA at $0.675 is important, but the critical line in the sand is the May 23 low of $0.652. A failure at that level will invite further losses down the junction of the May descending trend line, with the 78.6% retracement level of the rally originating in December 2020 at $0.555.
The 38% gain over the eight days to yesterday outperformed the previous bounces during the corrective process, marking a change in XRP price personality. Ripple still faces stiff resistance, but it has created a magnitude of momentum that could strike a breakout over $0.775 and launch the international settlements token to $1.00 in the immediate future.
Here, FXStreet's analysts evaluate where Ripple could be heading next as it advances further.
Author

Sheldon McIntyre, CMT
Independent Analyst
Sheldon has 24 years of investment experience holding various positions in companies based in the United States and Chile. His core competencies include BRIC and G-10 equity markets, swing and position trading and technical analysis.


