XRP price prediction: bullish pattern signals 25% rally in store
- XRP price has set up multiple inverse head-and-shoulders set up over the past few years.
- The latest formation, forecasts a 24% upswing to $0.673.
- Sentiment among XRP holders is bullish, pushing the asset past long-standing hurdles.

XRP price wiped out losses from the SEC’s crackdown on cryptocurrencies in the first week of June, surpassing key price levels as users digested the contents of Hinman documents. The altcoin’s recent consolidation has resulted in a bullish formation, a setup that hints at a breakout for XRPLedger’s native token holders.
XRP price and its history of inverse head-and-shoulders
XRP price set up an inverse head-and-shoulders setup on the three-day chart in 2019 and 2020. The breakout from this technical formation initially resulted in a nearly 190% ascent. After a full retrace and retest of the neckline, the XRP price rallied 607% between March and April 2022.
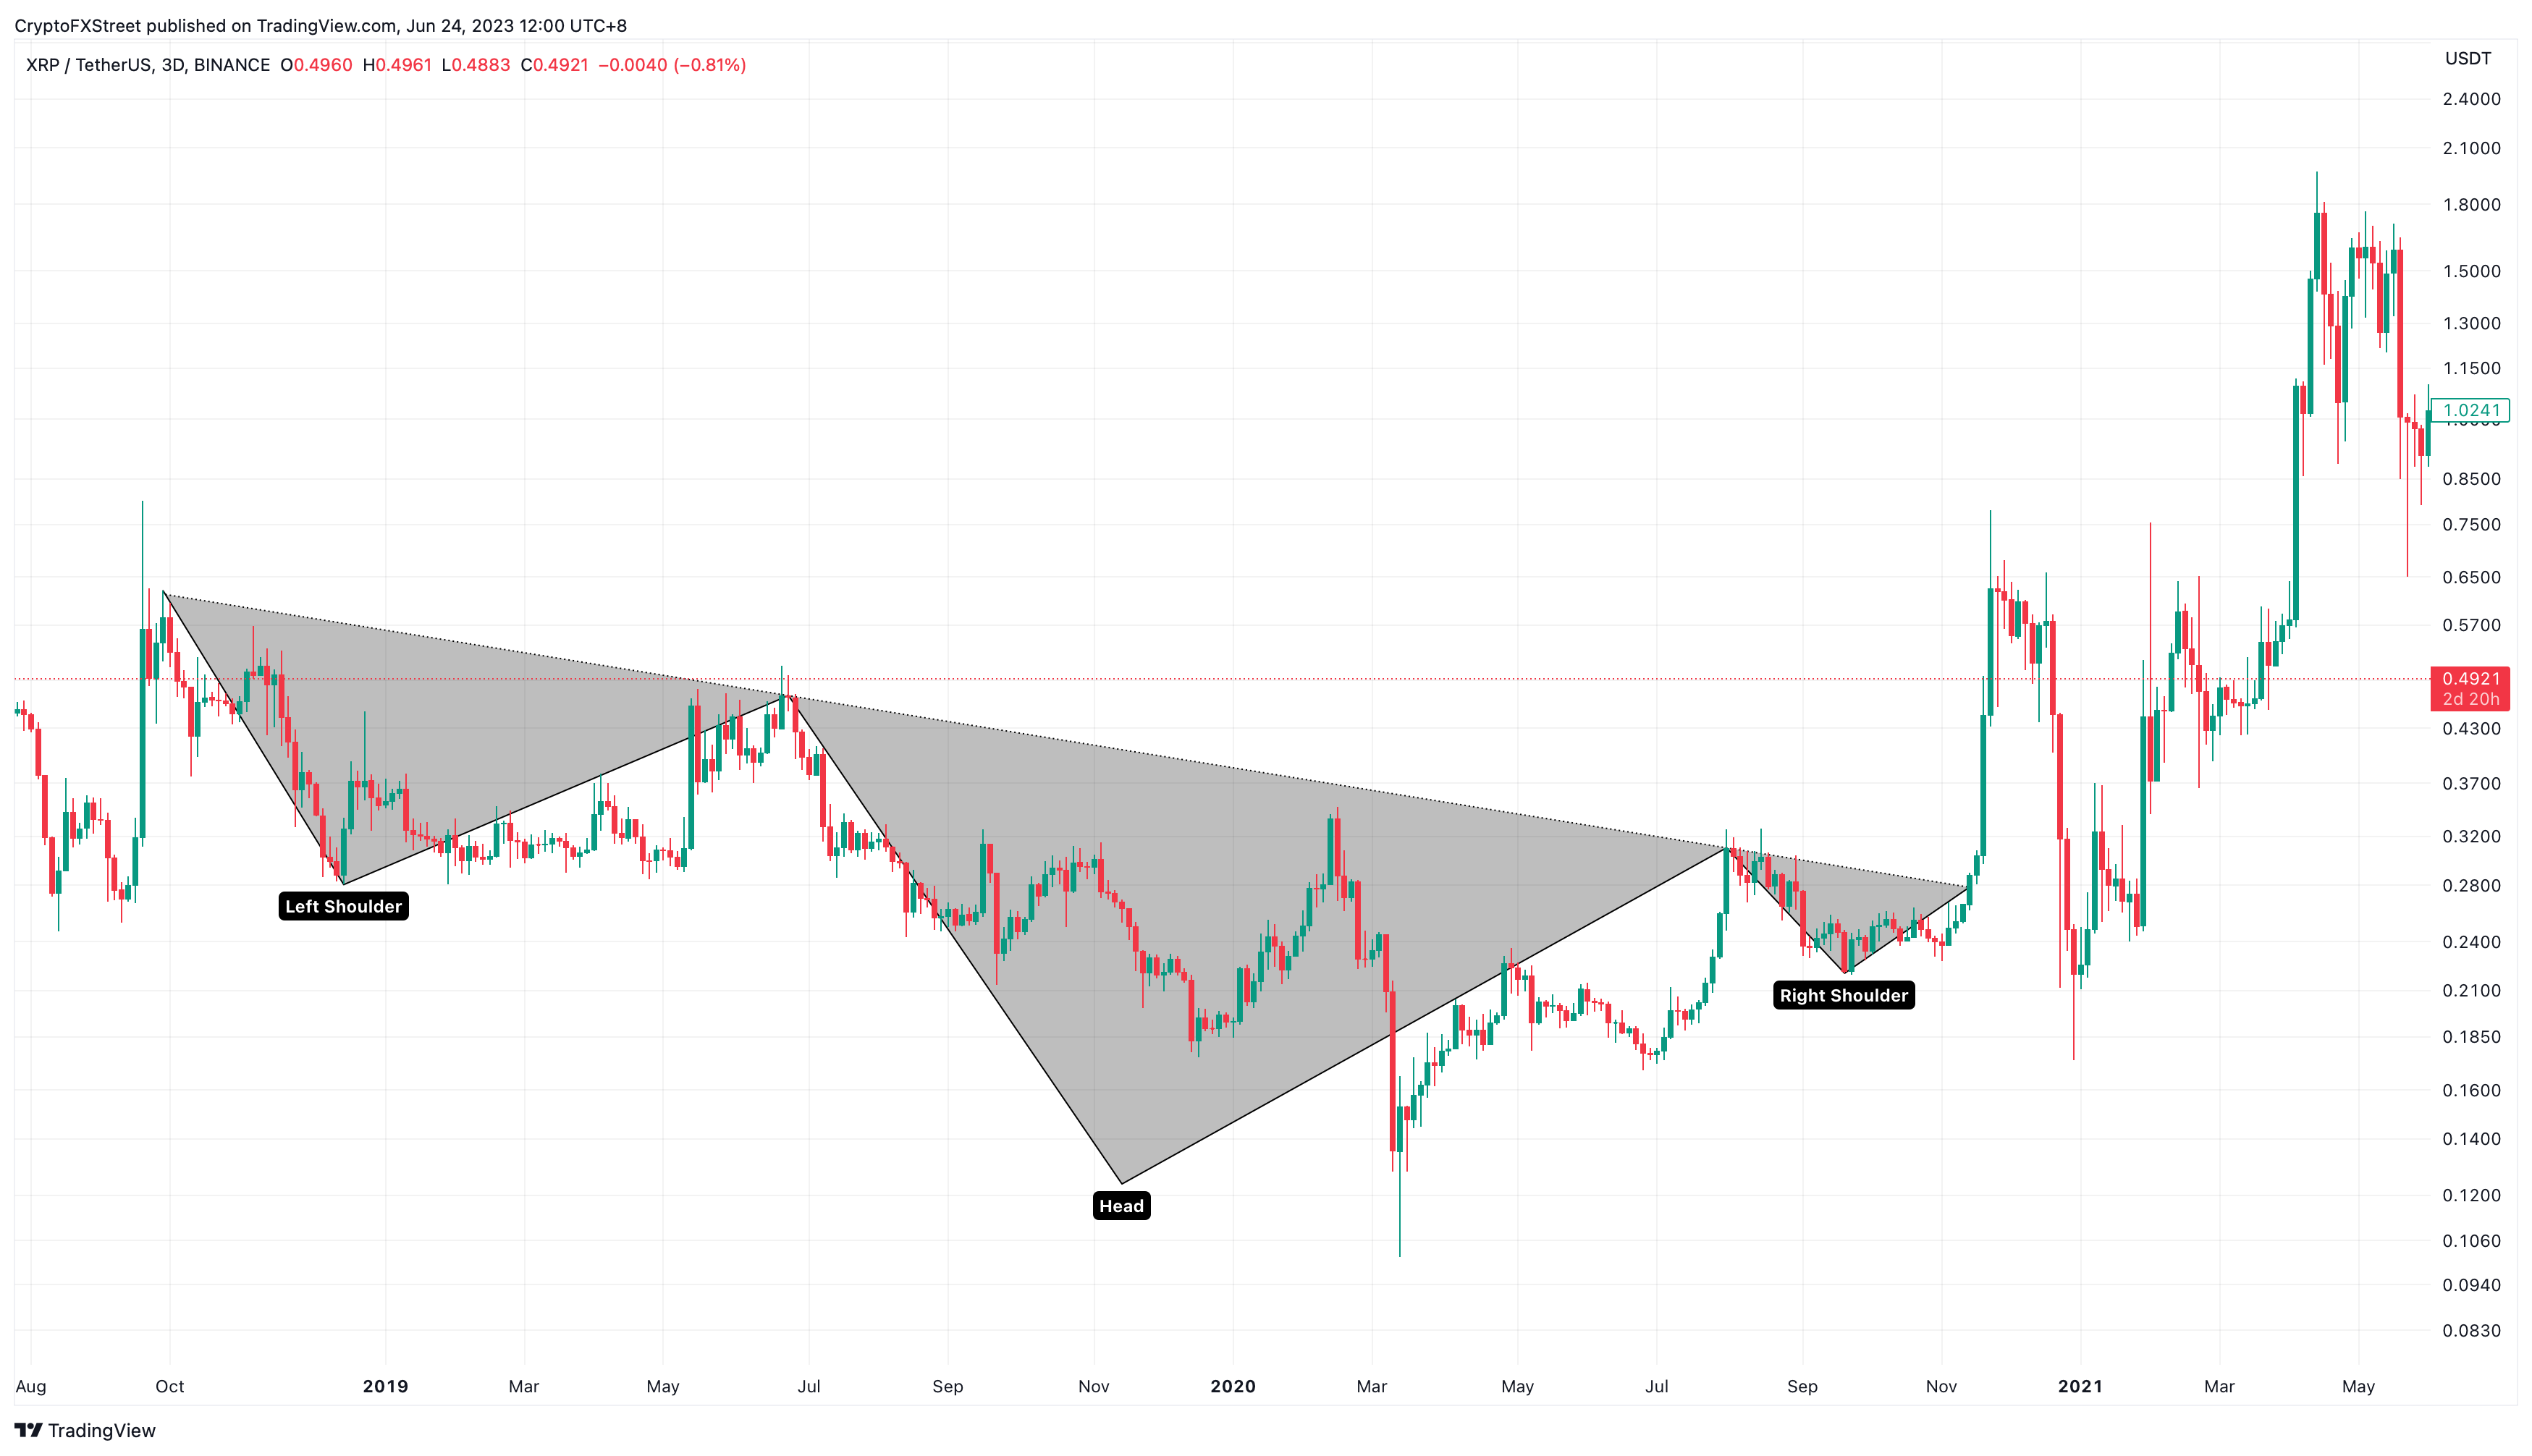
XRP/USDT 3-day chart
The most recent example of the inverse head-and-shoulders setup was in May 2023. After a decisive breakout above the neckline on May 26 XRP price rallied 12% to hit the forecasted target at $0.525.
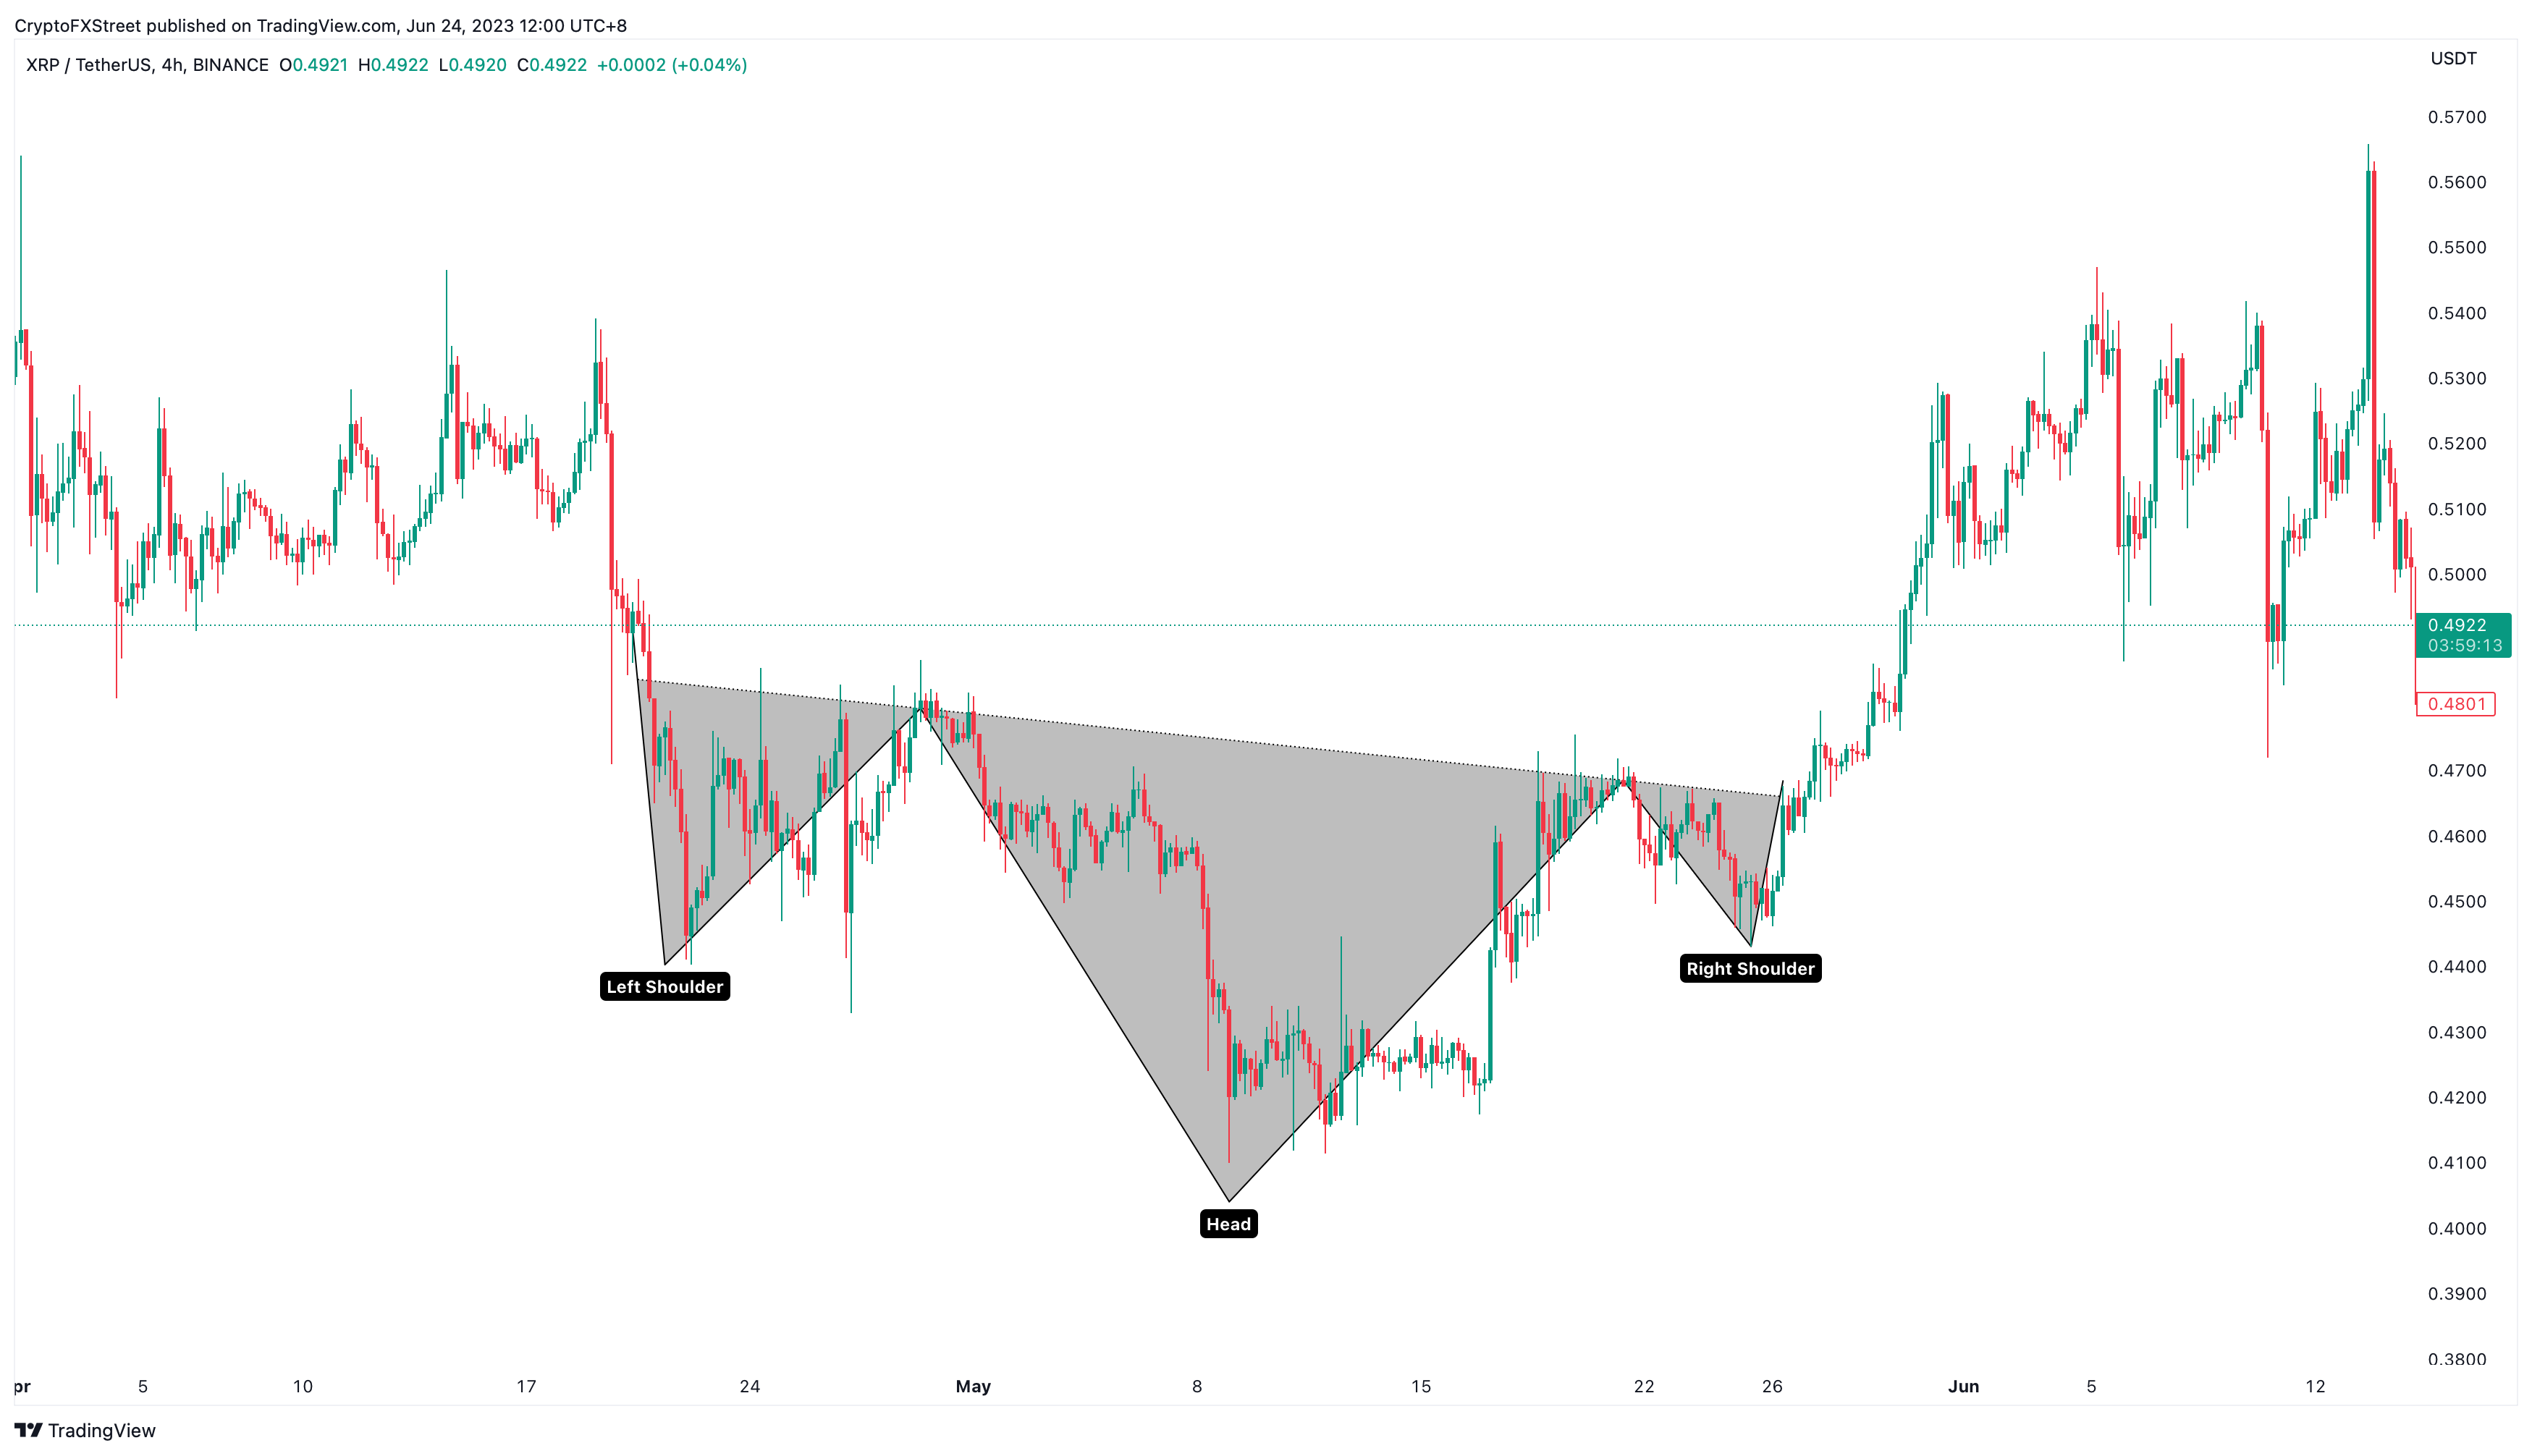
XRP/USDT 4-hour chart
Read more: XRP price could reach new 2023 high as institutional interest grows
XRP price gears up for the next big move
XRP price has set up an inverse head-and-shoulders setup on the daily timeframe. The price action, extending from late March to June 24, shows three distinctive swing lows. The central one is steeper than the rest and is termed the “head.” On either side of the head are “shoulders,” which swing lows of nearly comparable depths.
Connecting the swing highs of these three valleys shows the formation of a neckline. A decisive move above this neckline is considered a successful breakout. In such a case, the target for the setup is obtained by measuring the distance between the head’s right peak and its lowest point and adding it to the breakout point.
In Ripple’s case, the setup forecasts a 24.33% ascent to $0.673.
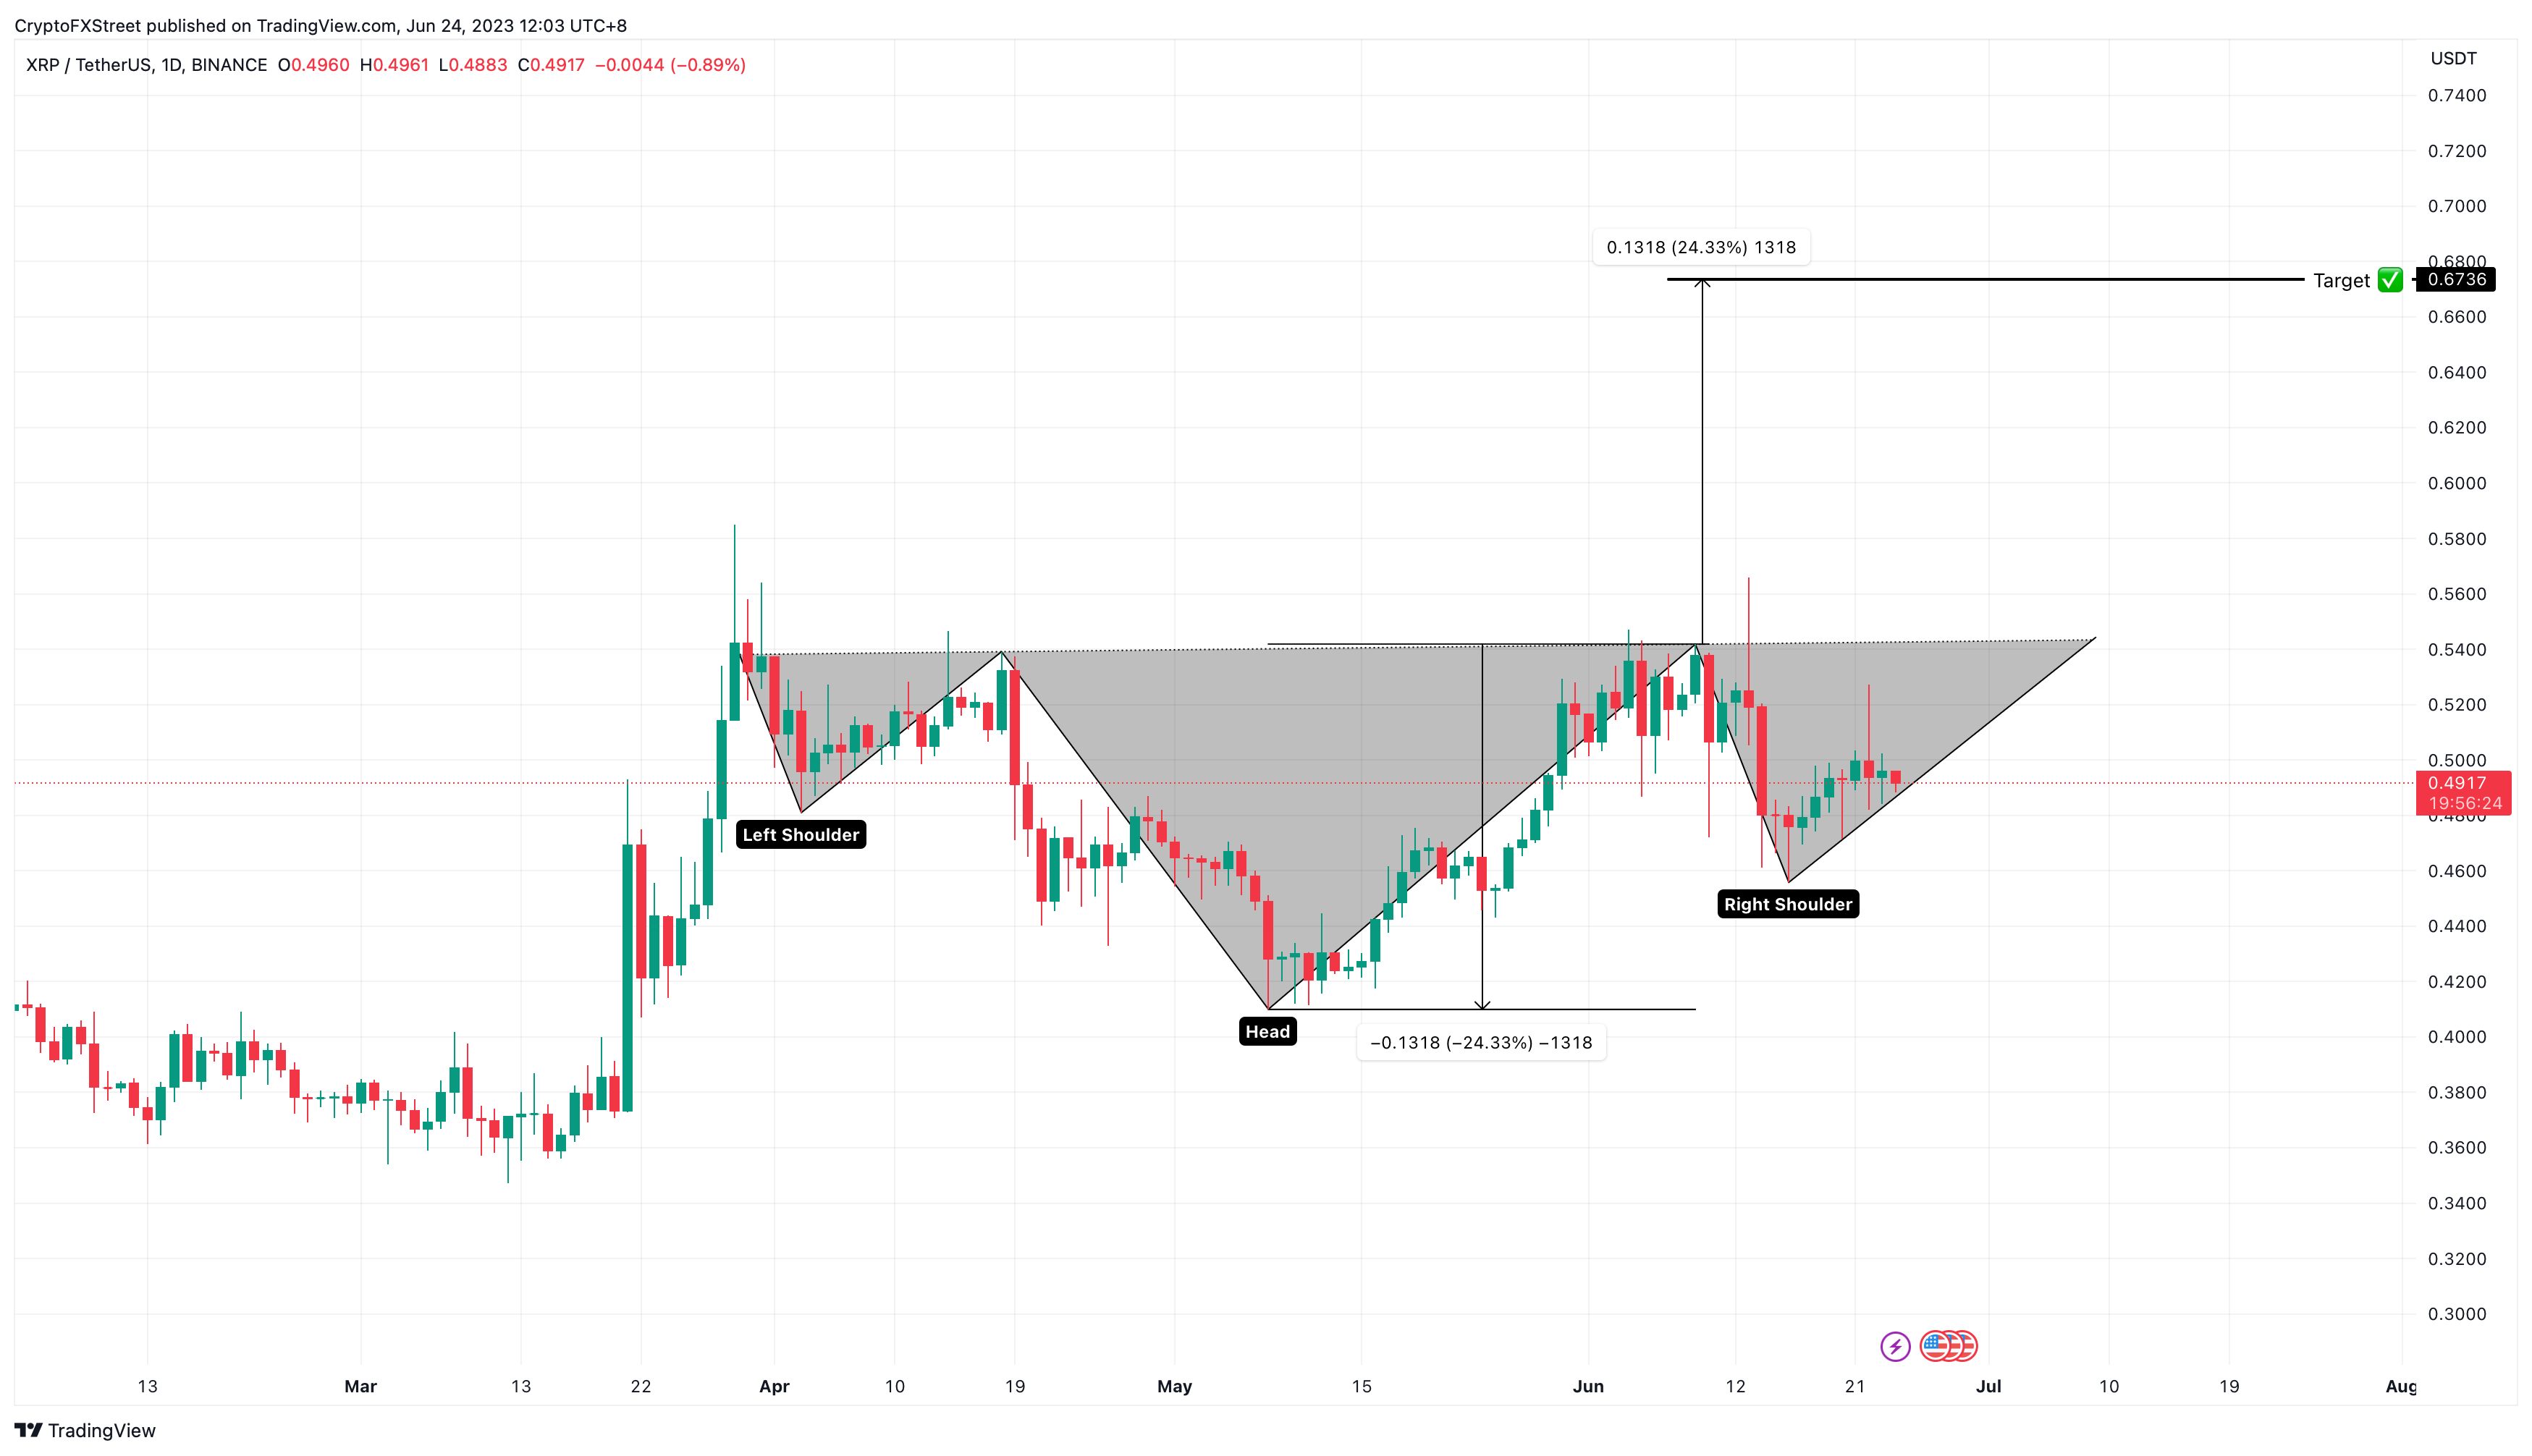
XRP/USDT 1-day chart
Considering that the XRP price is still forming the right shoulder, it is too early to tell if this potential bullish setup will be complete. A failure to form the right shoulder and breakout above the neckline will mean a weak bullish camp for the remittance token.
If XRP price produces a lower low below the June 16 swing low at $0.455, it will invalidate the bullish setup. Such a move could potentially trigger a 12% correction that retests the May 8 swing low at $0.410.
Experts say XRP bullish breakout could be under way
XRP price is on the cusp of breaking out of the Multi Year Ascending Triangle (MYAT), according to crypto analysts at the firm Egrag Crypto (@egragcrypto). The success rate of the analysts’ prediction is 72.77%.
Based on the statistics, a projected breakout date is approaching in July. The analysts use the inverted hammer formation as a sign to determine that the July breakout is in the marking..
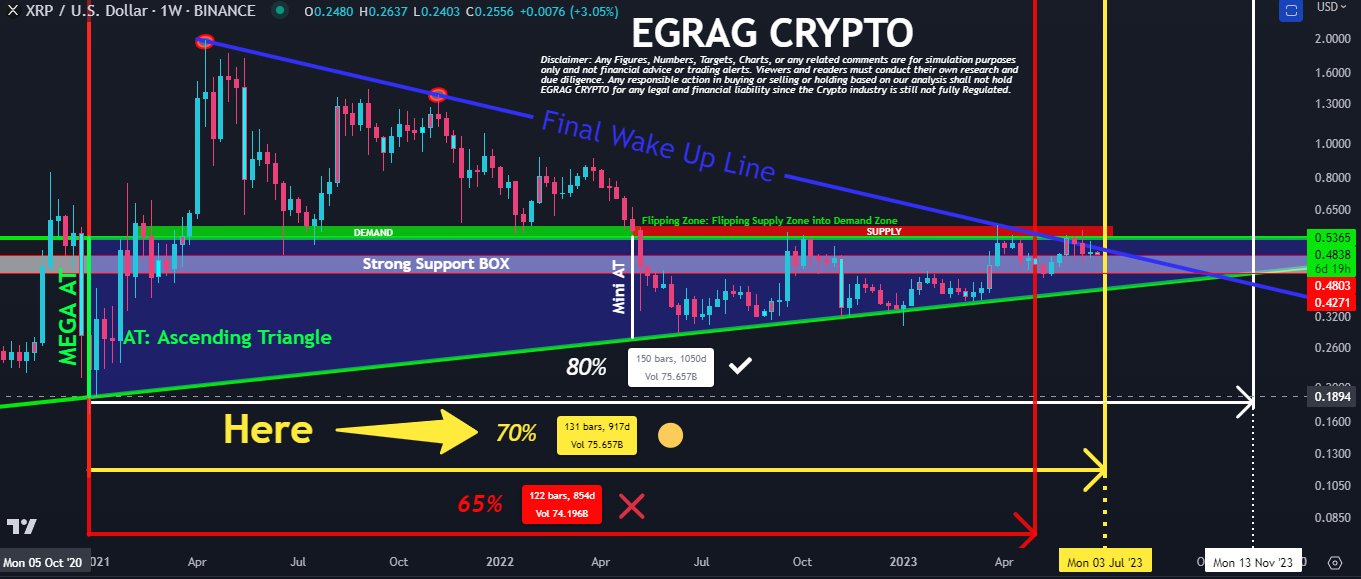
XRP bullish breakout prediction
Selling pressure on XRP is weakening and experts have noted the emergence of new buyers across exchanges. The short-term support targets are $0.48, $0.46, and $0.42. Short-term resistance levels are $0.50, $0.53 and $0.58.
Also read: Top 3 Price Prediction Bitcoin, Ethereum, Ripple: Crypto markets take a breather
Author

Akash Girimath
FXStreet
Akash Girimath is a Mechanical Engineer interested in the chaos of the financial markets. Trying to make sense of this convoluted yet fascinating space, he switched his engineering job to become a crypto reporter and analyst.


