XRP Price Prediction: Ripple commences 70% bull rally
- XRP price consolidates the persuasive breakout from a bullish bottoming pattern.
- The fourth-largest cryptocurrency by market capitalization closed April with a gain of 180%.
- Ripple is a classic high-risk, potentially high-return cryptocurrency opportunity.

XRP price broke the neckline of an inverse head-and-shoulders pattern on April 29, sending Ripple up over 13% for the day. The bottoming pattern projects a notable advance moving forward, exceeding the psychologically important $2.00.
XRP price rewarding the buy the dips investment philosophy
On April 29, the same day as the breakout from the inverse head-and-shoulders bottom, the Santiment MVRV ratio (30-day) for XRP price reached 37.7%. It was one of the highest metric readings going back to 2018, highlighting Ripple was getting overvalued.
The MVRV ratio is two terms. ‘MV’ as in Market Value simply describes the market capitalization, which is well-known when looking at crypto assets. The second part is ‘RV,’ which stands for Realized Value. It gives you an estimate of how overvalued or undervalued the asset is. The higher the reading, or overvalued, the higher the probability of people willing to sell and take profits. The lower the reading, or undervalued, the lower the probability of selling because people would realize losses.
During strong and long bull runs, the MVRV ratio tends to grow, and during bear markets, it is decreasing. The rational is that during strong bull runs, the long-term holders determine when the bull run will end by selling positions, while during bear markets, the long-term holders are at loss on average, and the short-term holders manage to realize profits.
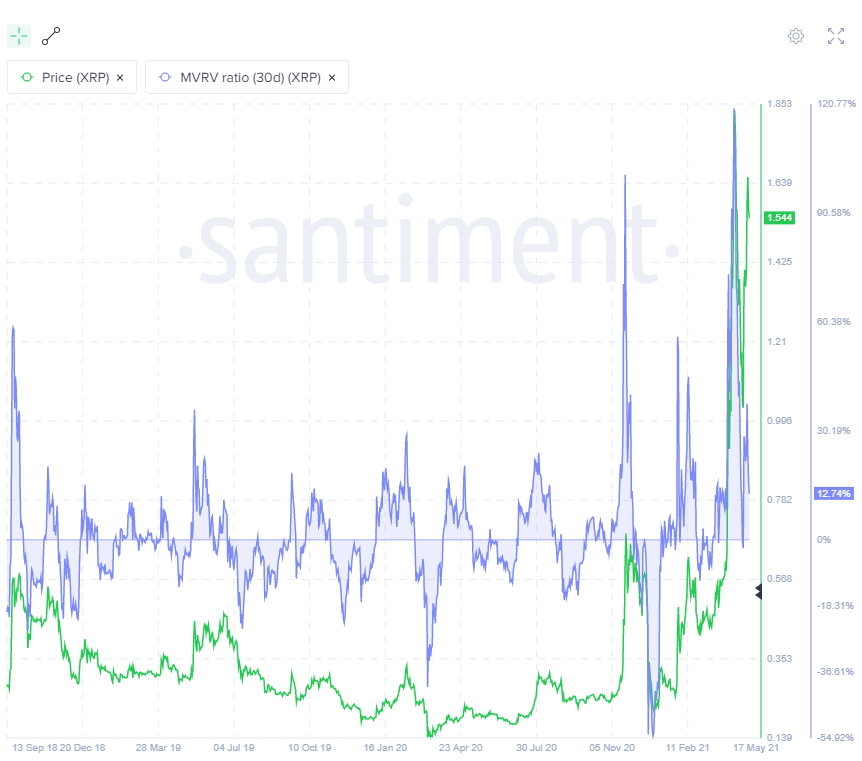
XRP MVRV ratio
After rallying 180% in April, 50% for the week and 13% for the day, it is no coincidence that the MVRV ratio did reach a high reading and that long-term holders did liquidate some of their positions. April 30 high at $1.66 could be a local top, but the firmness of price over the last four days suggests that XRP price is just consolidating.
Resistance is anticipated to unfold at the 78.6% Fibonacci retracement of the April decline at $1.73, about 10% above the current price. Ripple enthusiasts are fixated on the psychologically important $2.00 and the 61.8% retracement of the 2018-2020 bear market at $2.08. The XRP price oscillations around $1.00 in early April propose that $2.00 could be imposing.
The measured move target of the inverse head-and-shoulders pattern is $2.47, a gain of 70% from the neckline position on April 29 and nearly 60% from the current XRP price. Aggressive speculators should look to the 78.6% retracement of the 2018-2020 bear market at $1.62 as the ultimate resistance.
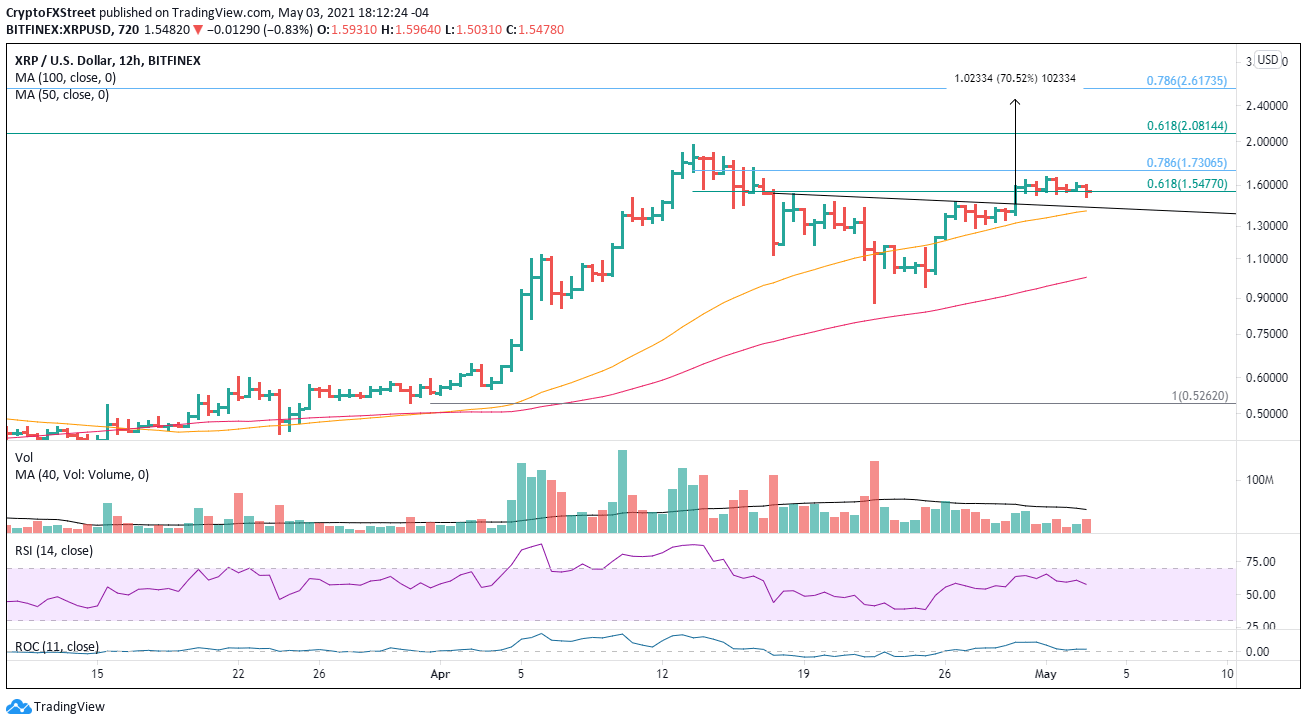
XRP/USD 12-hour chart
Speculators need to be aware of a negative news roll regarding the SEC lawsuit or simply a new collective decline in the cryptocurrency complex. If so, XRP price will find support at $1.40 and then $1.28, but the legitimate level to watch out for is $1.00.
Author

Sheldon McIntyre, CMT
Independent Analyst
Sheldon has 24 years of investment experience holding various positions in companies based in the United States and Chile. His core competencies include BRIC and G-10 equity markets, swing and position trading and technical analysis.




