XRP Price Prediction: Ripple prepares for a 70% upswing
- XRP price shows signs of an upswing as it bounces off a stable support barrier around the $0.38 level.
- This bounce was crucial in keeping Ripple’s ascending parallel channel pattern intact.
- The “buy signal” from the SuperTrend indicator coupled with the bullish momentum suggests that a 70% upswing is possible.

XRP price hit a local top on February 13 at $0.64, followed by a correction that pushed it down by 40%. In hindsight, this top coincided with the ascending parallel channel’s upper trendline. Now, the remittance token is preparing for another leg-up as it witnesses a spike in buying pressure.
XRP price eyes a higher high
XRP price correction seen on December 29, 2020, January 27, and February 23 formed the swing lows. On the other hand, Ripple price action on December 25, 2020, and February 13 resulted in swing highs. Drawing trendlines along the pivot points creates an ascending parallel channel.
Although XRP hasn’t broken out of the channel, the target for such a technical pattern is determined by adding the channel’s height to the breakout point. This setup has a bearish bias and tends to breakout lower.
However, as mentioned above, XRP price managed to bounce off the channel’s lower trendline. This bullish momentum indicates that buyers might push Ripple by 70% towards the $0.78 level.
Supporting this bullish momentum is the SuperTrend indicator’s buy signal, which also played a vital role in the said bounce.
Investors should note that this run-up isn’t without hurdles. XRP price rally will face a supply barrier around the $0.57 area, a confluence of the 78.6% Fibonacci retracement level, and the channel’s middle line. A decisive daily candlestick close above this price point would instill confidence in buyers, pushing XRP to its target at $0.78.
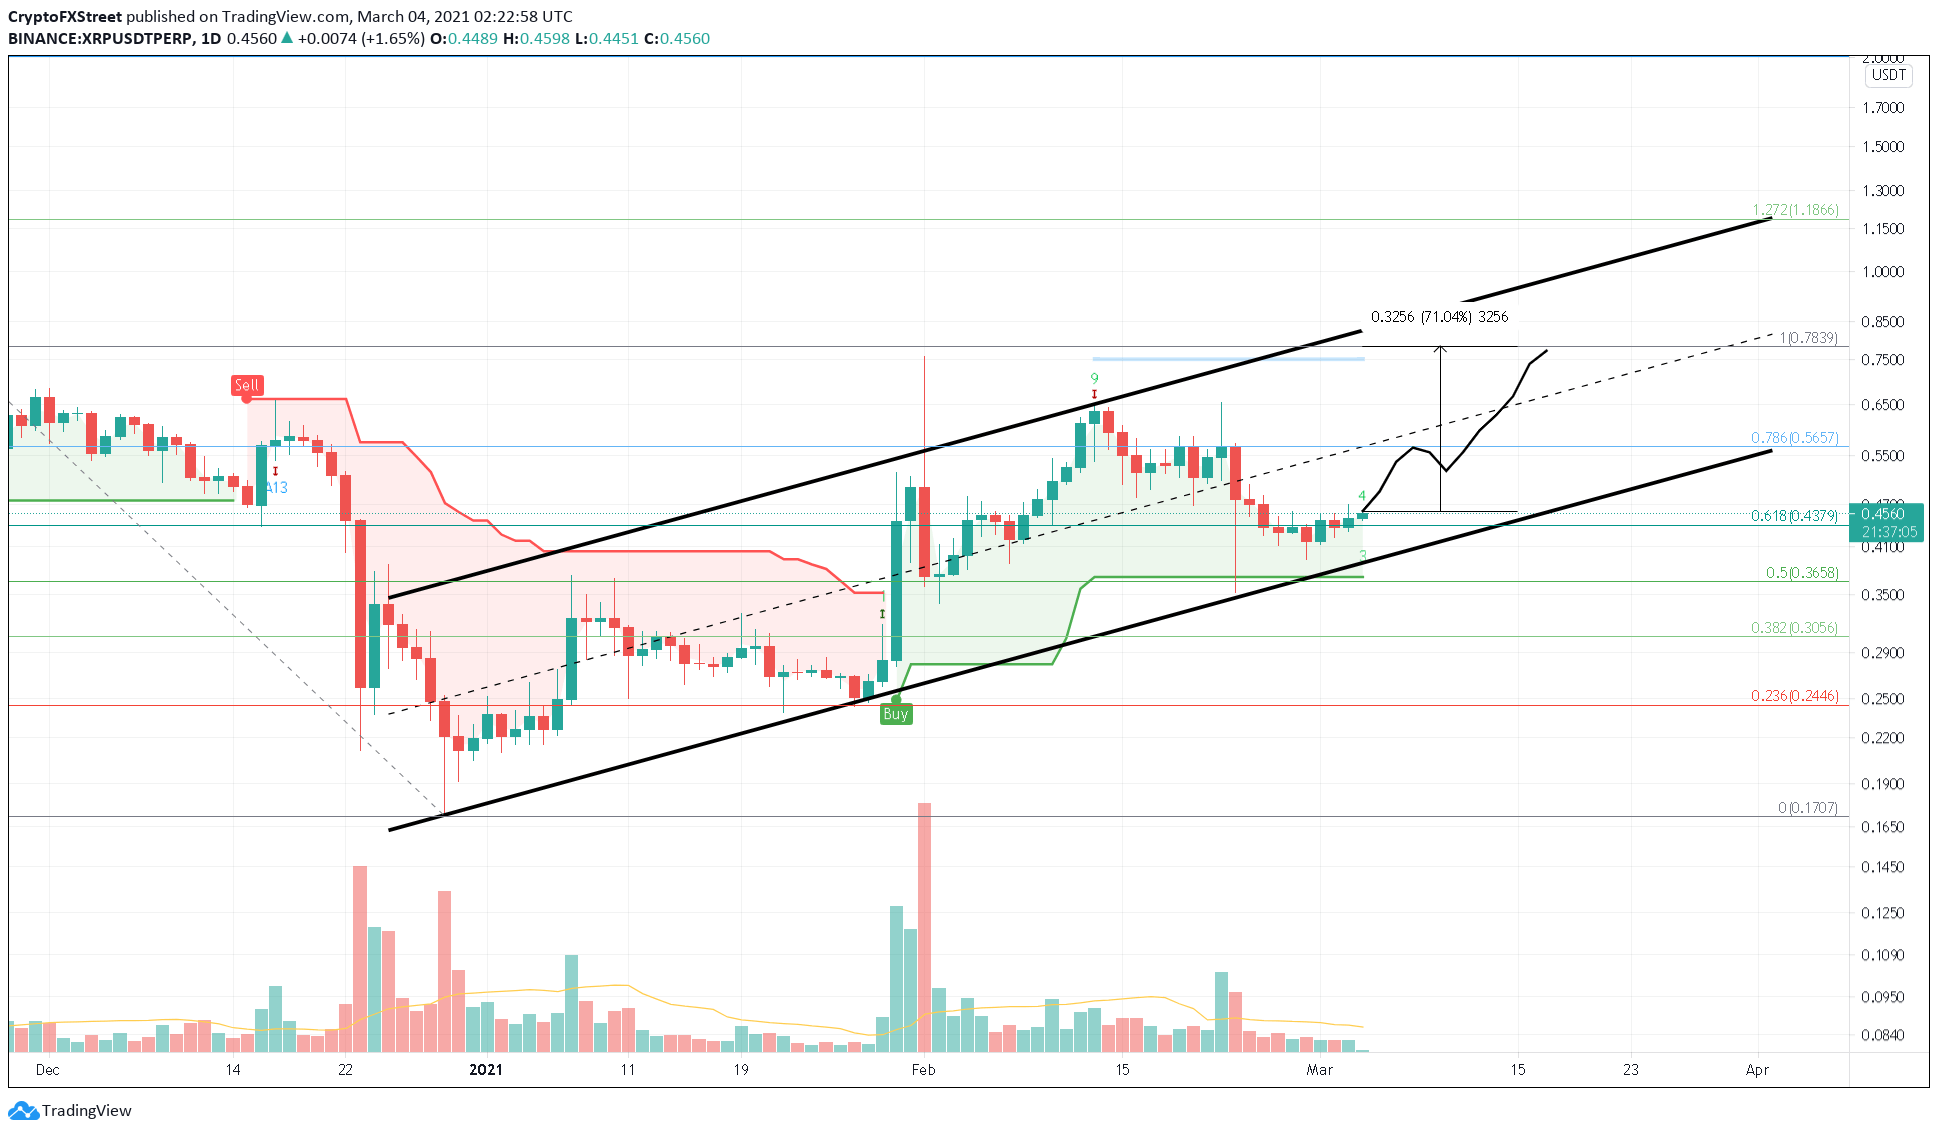
XRP/USDT 1-day chart
Contrary to the bullish outlook, a lackluster performance by bulls could trigger a pullback. If this correction leads to a daily candlestick close below the 50% Fibonacci retracement level at $0.36, it will invalidate the bullish thesis and the SuperTrend indicator’s buy signal.
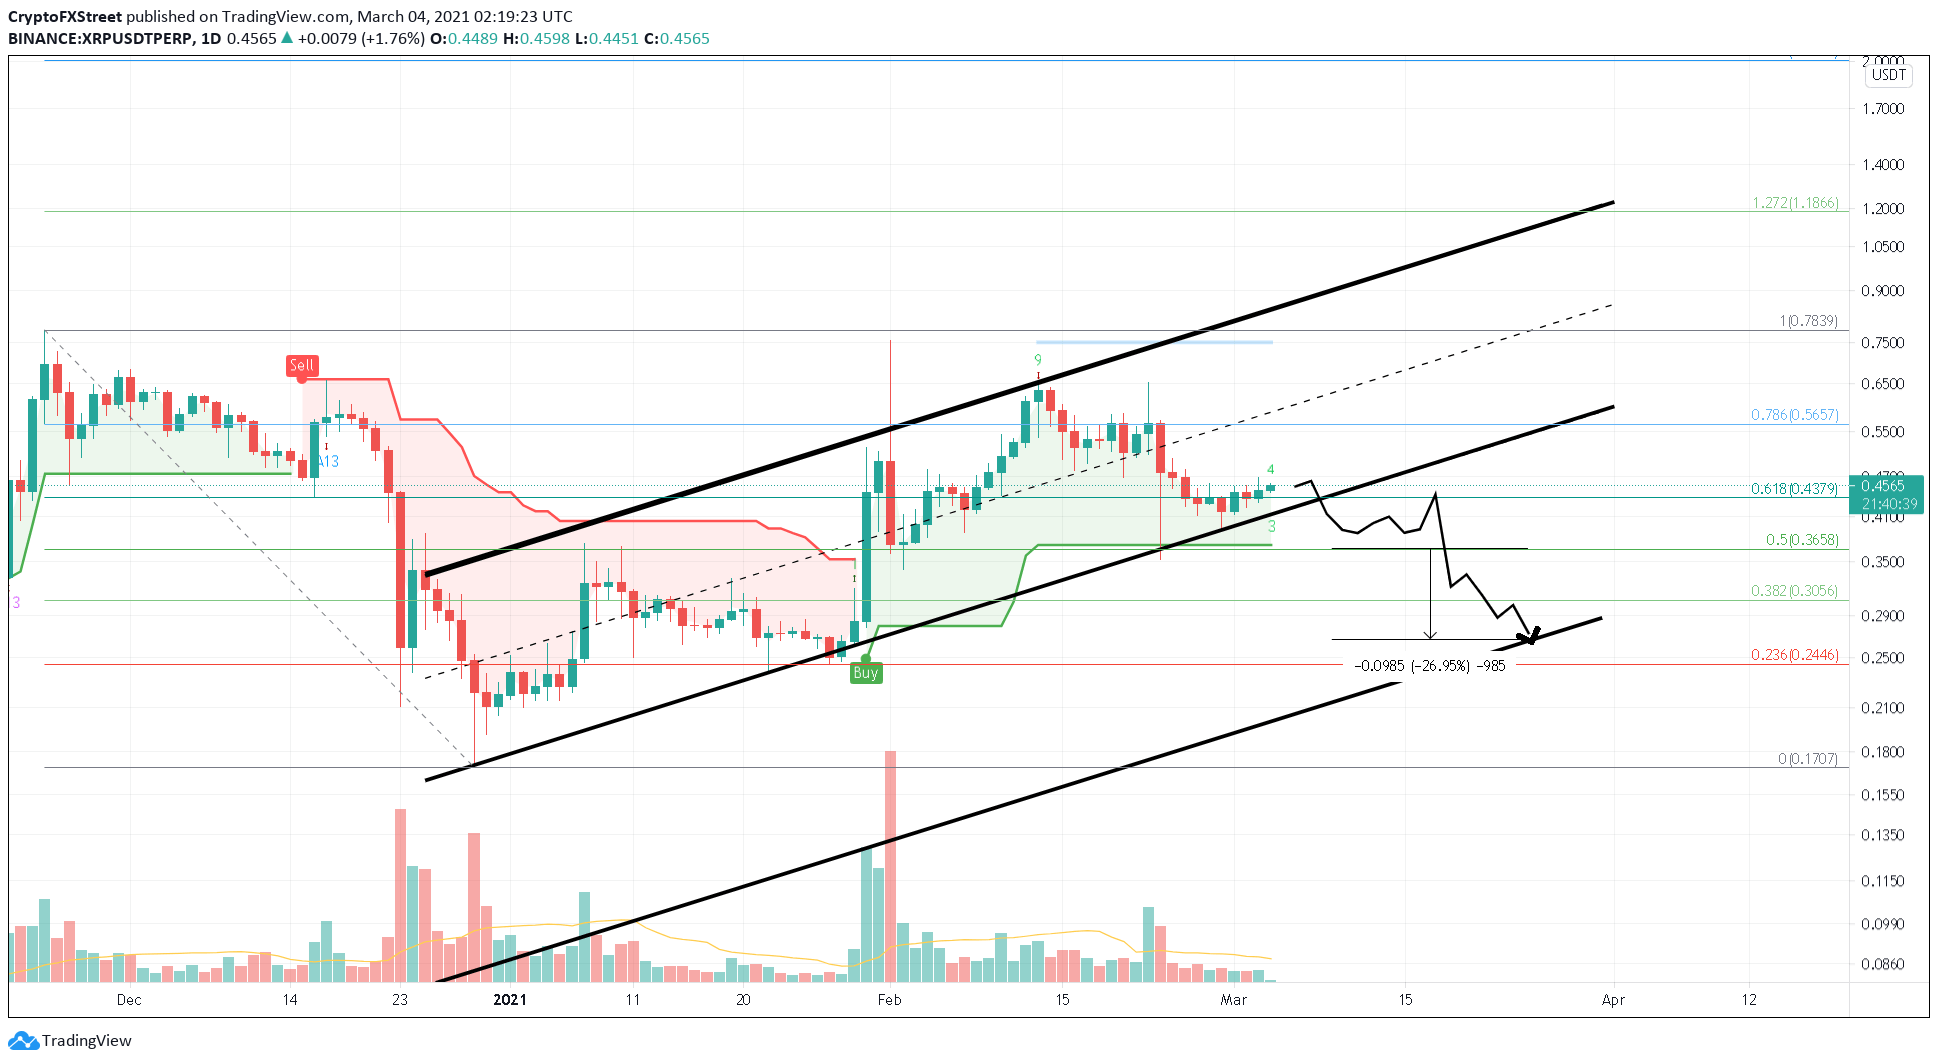
XRP/USDT 1-day chart
In such a case, XRP price could slide past the 38.2% Fibonacci retracement level at $0.30 and hit $0.26.
Author

Akash Girimath
FXStreet
Akash Girimath is a Mechanical Engineer interested in the chaos of the financial markets. Trying to make sense of this convoluted yet fascinating space, he switched his engineering job to become a crypto reporter and analyst.



