XRP Price Prediction: Ripple legal clarity could trigger a new rally
- XRP price rebounds, triangle’s lower trend line to be exceptional resistance moving forward.
- Psychologically significant $1.00 provides support for the second time in a month.
- Egypt’s largest bank joins Ripple network for cross-border payments.

XRP price collapsed almost 50% today at the intra-day low but has rebounded to show a decline of 31%. A near-term resolution to the SEC battle, which many believe will be the case, combined with rumors of an IPO following the case’s conclusion, may put Ripple in a solid position to lead the cryptocurrency market over the long term.
XRP price knocked down, but not out
Digital asset investors have been reminded of the dangers of investing in an emerging asset class. Still, today’s historic drop in the cryptocurrency market came as a complete shock for most retail and institutional investors.
It is still unknown how many retail investors who followed the social media hype and leveraged their portfolios to cryptocurrencies have blown out their accounts. To be sure, there are a lot of regrets and second-guessing tonight, and Ripple investors are a part of that group.
XRP price has delivered a challenging trading environment since the April high, but the charts had begun to clarify the notable volatility into a wide symmetrical triangle pattern. Yesterday, Ripple tried to release from the triangle but was quickly rejected, creating a bull trap.
Today, XRP price destroyed the triangle’s lower trend line and plummeted to the confluence of the April low at $0.874 and the 61.8% Fibonacci retracement of the rally originating at the beginning of 2021 at $0.856.
On the 12-hour chart, there is a hint of opportunity emerging as XRP price may close with a bullish hammer candlestick pattern if the rebound continues. The real body should not be larger than 1/4th to 1/3rd of the range of the hammer formation. An ideal close would be above the May 12 low of 1.20. It would confirm that buyers overcame the selling.
To note, the April decline ended with a hammer pattern on the 12-hour chart.
The high of the formation at $1.32 is the trigger price. Still, the price converges with the triangle’s lower trend line, presenting a more significant obstacle for investors searching for a timely entry price.
Suppose XRP price successfully overcomes the challenging resistance. In that case, Ripple will encounter further resistance at the 50 twelve-hour simple moving average (SMA) at $1.46 before it can make another attempt at rallying beyond the May 5 high at $1.76.
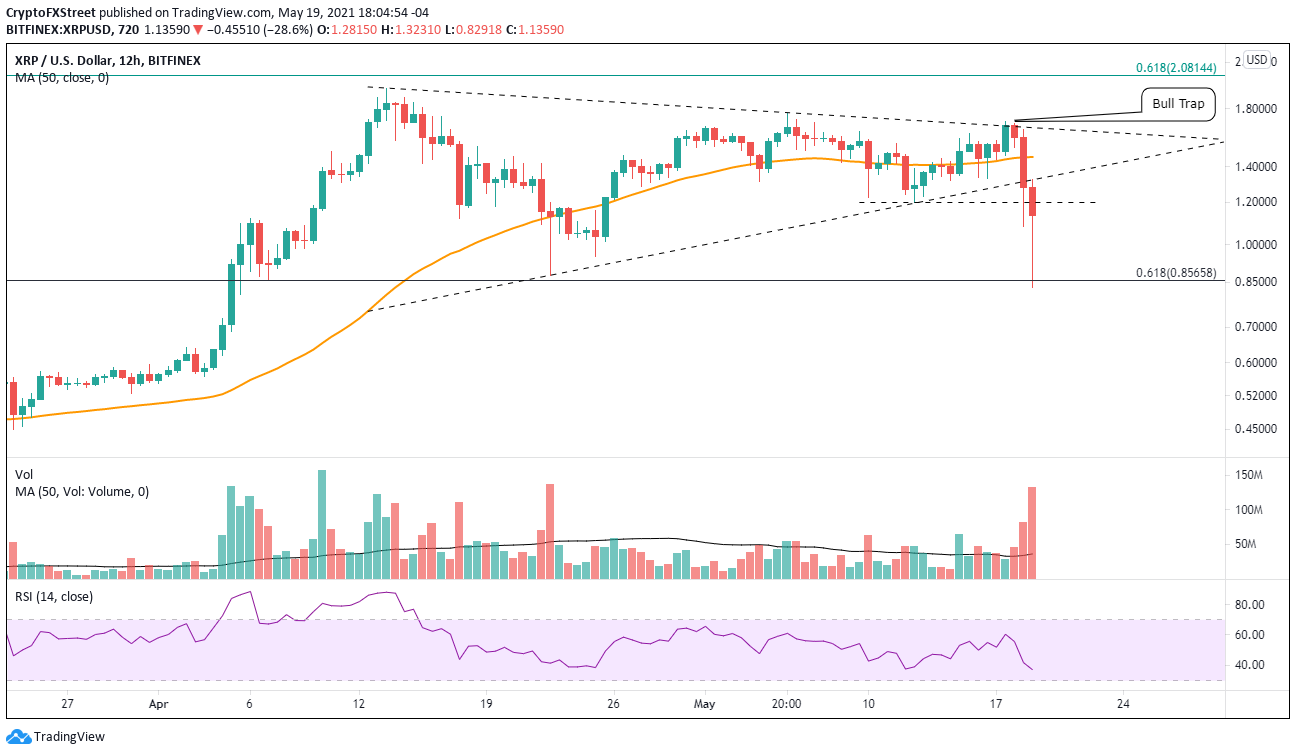
XRP/USD 12-hour chart
Ripple still has a few hours left in today’s trading, so a renewal of selling pressure could undermine the attempt at a bullish hammer candlestick pattern. Support levels are difficult to see until the range between $1.00 and today’s low at $0.82.
Author

Sheldon McIntyre, CMT
Independent Analyst
Sheldon has 24 years of investment experience holding various positions in companies based in the United States and Chile. His core competencies include BRIC and G-10 equity markets, swing and position trading and technical analysis.


