XRP Price Forecast: Ripple consolidates, but $3.30 in the crosshairs
- XRP price shows intense indecision with two weekly doji candlesticks in the last five weeks.
- Tactically important 10-week simple moving average (SMA) still chasing price.
- Weekly Relative Strength Index (RSI) displays a bearish momentum divergence at the April high.

XRP price is shaping a symmetrical triangle pattern that is often considered a continuation pattern, but it can resolve both ways. The emerging pattern offers some clarity to the uneven price action over the last month and solidifies the short-term neutral outlook for the international settlements token.
XRP price turbulence provides mixed signals for investors
Over the last five weeks, XRP price has closed with two doji candlesticks, and Ripple may close with another one this week. The indecision exemplified by the pattern and amplified by the fact it is occurring on a weekly chart presents a challenge for the bullish narrative and an upward resolution to the emerging symmetrical triangle pattern.
The bullish XRP price outlook can be renewed with a rally above the triangle’s upper trend line at $1.67 and a daily close above last week’s doji high at $1.76. The respite from the indecision will put buyers back in control of Ripple and project higher returns for the altcoin.
Immediate resistance upon breakout will be the April high at $1.96, followed closely by the psychologically important $2.00 and the 61.8% Fibonacci retracement of the 2018-2020 decline at $2.08. Combined, the three levels present a formidable challenge for the bullish XRP price narrative.
A successful rally above the area of $2.00 puts XRP price in an excellent position to test the 78.6% retracement of the 2018-2020 decline at $2.61, a gain of 80% from price at the time of writing.
The potential of a positive resolution to the SEC case with Ripple, combined with rumors of an IPO following the case, has many investors focused on the all-time high at $3.30. It has been proven this year by other cryptocurrencies that all-time highs can be a powerful magnet for price.
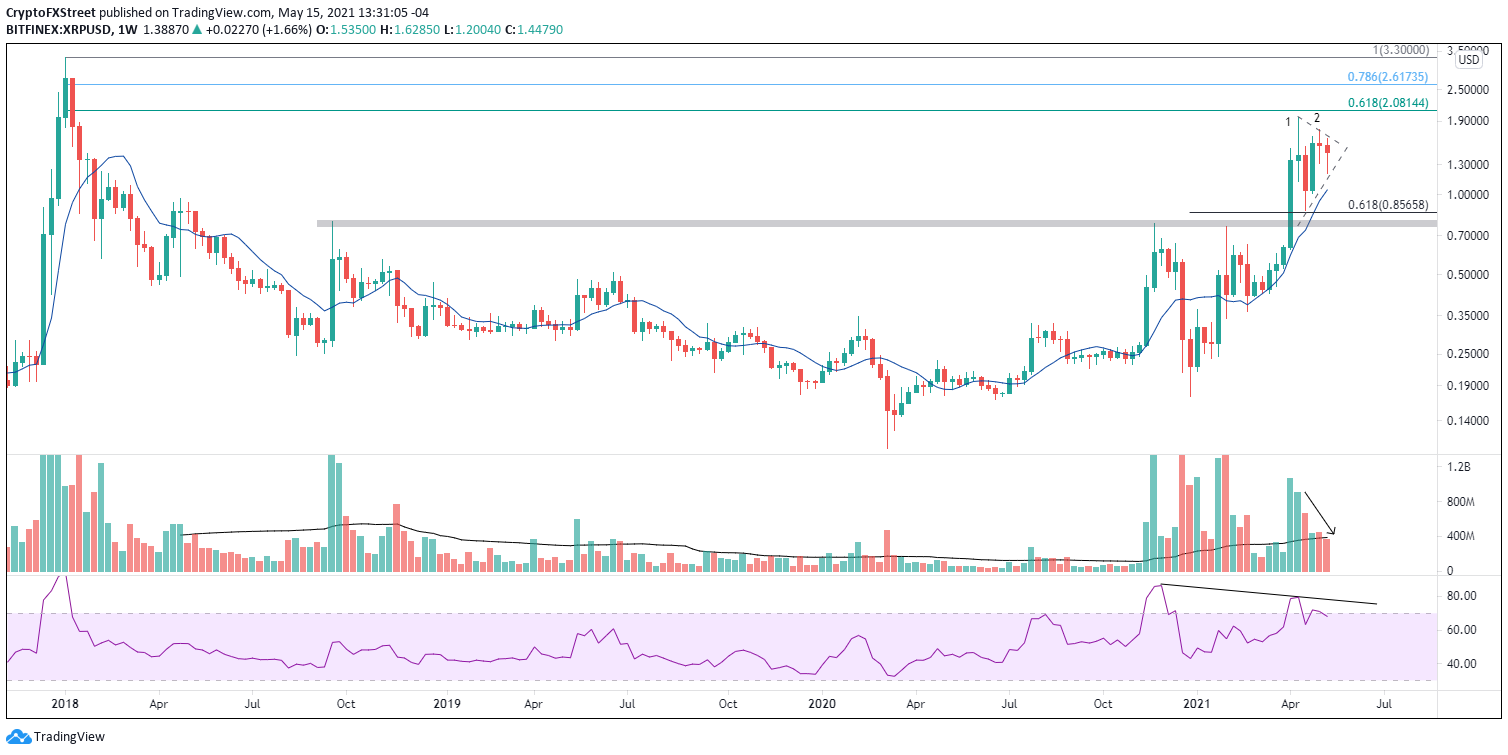
XRP/USD weekly chart
The bearish alternative for Ripple begins with a break below the triangle’s lower trend line at $1.14. Still, the downside could be limited by the tactically important 10-week simple moving average (SMA) at $1.04 and then the critically important $1.00.
Author

Sheldon McIntyre, CMT
Independent Analyst
Sheldon has 24 years of investment experience holding various positions in companies based in the United States and Chile. His core competencies include BRIC and G-10 equity markets, swing and position trading and technical analysis.


