China crypto ban wreaks havoc on the markets, but Musk came to the rescue
- Bitcoin price drops 30% and reaches the head-and-shoulders measured move target of $33,400.
- Ethereum price plunges below $2,000 for the first time since March 31.
- Ripple price sliced through the psychologically important $1 and tested the April low of $0.874.

Bitcoin price plummeted for the fifth-straight day, taking the bellwether cryptocurrency down 29% on an intra-day basis and 50% from the all-time on April 14 of $64,899. Other cryptocurrencies suffered more extreme selling, with Ethereum collapsing 40% and others more than 50%.
The cryptocurrency derivatives markets were hit with over $8 billion in position liquidations over the last 24 hours due to margin calls. JPMorgan said the selling showed the “steepest and more sustained liquidation” in bitcoin futures since October 2020.
In the midst of the chaos, Elon Musk sent out a cryptic tweet that seemed to give the market rebound some energy.
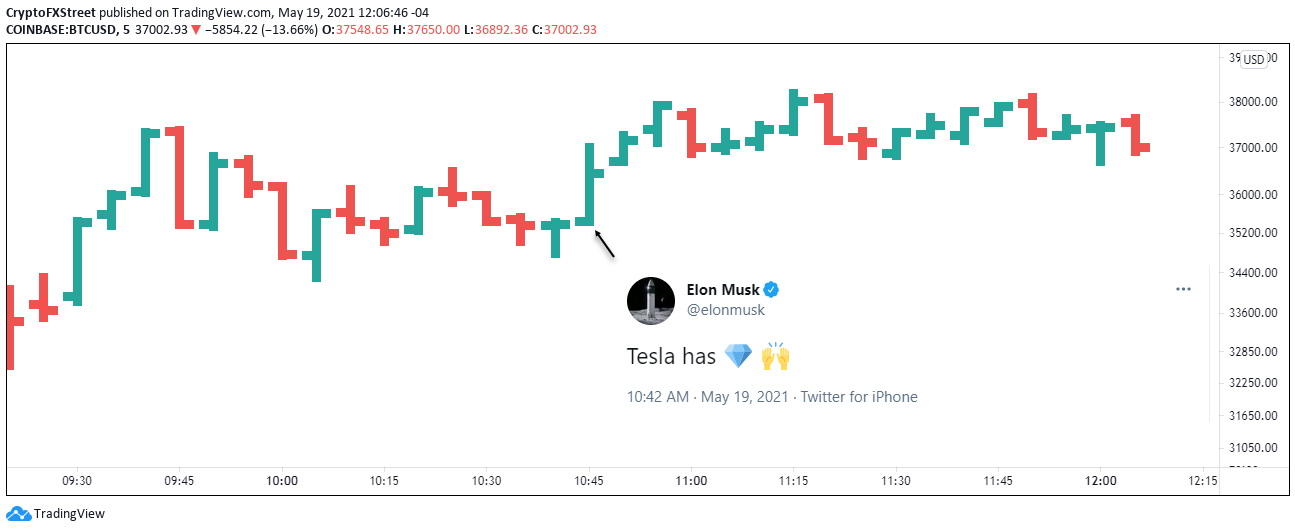
BTC/USD 5-minute chart
China tightens the noose around crypto
In a statement yesterday, three state-backed industry associations, the National Internet Finance Association of China, the China Banking Association and the Payment and Clearing Association of China, said, “cryptocurrency prices have skyrocketed and plummeted, and cryptocurrency trading speculation activities have rebounded.”
The statement warned Chinese investors against investing in the volatility of the cryptocurrency market because it is “seriously infringing on the safety of people’s property and disrupting the normal economic and financial order.”
As part of the ban, banks and online payment channels cannot offer any service related to cryptocurrencies, such as registration, clearing, trading and settlement. Moreover, the institutions may not provide cryptocurrency products, saving and pledging services for cryptocurrencies. And, on the PBOC WeChat account, the associations said that virtual currency “is not a real currency” and “should not and cannot be used as currency in the market.”
The new ban comes simultaneously as a broad-sweeping regulatory crackdown on the fintech sector. The biggest companies, including Alibaba and Tencent, were hit with huge fines due to monopolistic practices. ThePBOC has also been promoting its own digital yuan, which it is currently testing in pilot cases.
Bitcoin price pressure overwhelms pivotal support levels
Entering trading today, Bitcoin price rested at a critical juncture. The formidable support was defined by the convergence of the head-and-shoulder pattern’s neckline, the January high at $41,986, the February low at $43,016 and finally, the 38.2% Fibonacci retracement of the advance beginning in March 2020.
A May 12 FXStreet article projected that Bitcoin price might drop to $34,000, the measured move target of the head-and-shoulder pattern at that time. Today, BTC fell to $30,000, eclipsing the measured move target of $33,400. In the process, Bitcoin price overpowered the 200-day simple moving average (SMA) at $39,000 and the 50% retracement level of the rally since March 2020 at $34,380.
The selling pressure could return later today, but the earlier lows should hold. However, if Bitcoin price fails today or later this week, the next support level is the 61.8% retracement level of the advance from March 2020 at $27,175 and then the 2017 high at $19,891.
To complete a reversion to the mean (200-week SMA), BTC needs to fall to $12,600, a decline of over 60% from price at the time of trading, and highly unlikely.
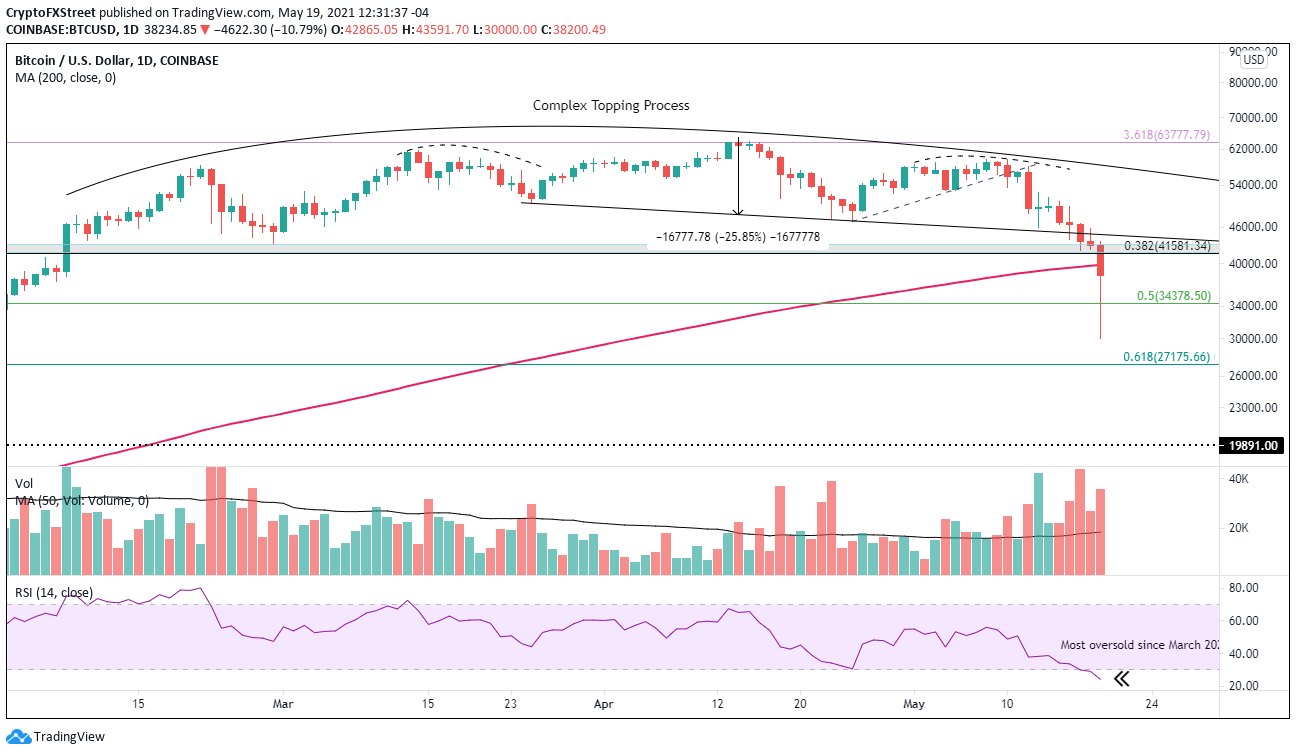
BTC/USD daily chart
If the rebound continues to generate support, Bitcoin price could close the day above the 200-day SMA, a notable technical achievement in light of the selling earlier in the day. It would still leave BTC vulnerable to residual selling in the coming days.
Ethereum price decline prompts selling at whatever price
Ethereum price displayed superior relative strength in April while the cryptocurrency market suffered heavy selling, building the basis for a 120% rally from the April 18 low at $2,000 until the May 12 high at $4,384.
This month's selling proved too challenging to overcome, and Ethereum price fell to the 78.6% Fibonacci retracement of the rally beginning the end of February, representing a 55% decline from the absolute high of May 12 at $4,384 and to today’s final low of $1,900.
Currently, Ethereum price is down 17.5%. It has retaken the 61.8% retracement level at $2,473, and if the rebound continues, ETH may close with one of the most significant hammer candlestick patterns in cryptocurrency history.
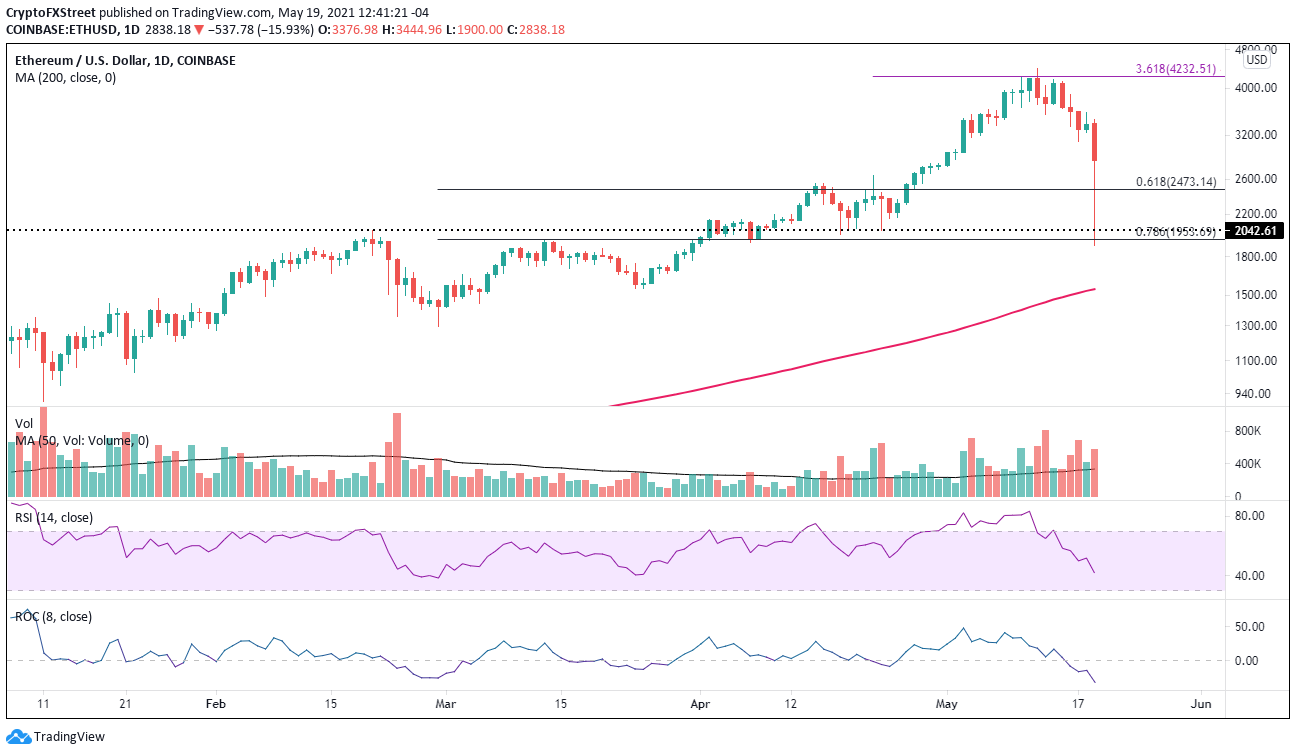
ETH/USD daily chart
A resurgence of selling should identify support around $2,000, a pivotal level extending back to February.
XRP price endures with a huge rebound
XRP price has delivered a challenging trading environment since the Apri high, but the charts had begun to clarify the notable volatility into a wide symmetrical triangle pattern. Yesterday, Ripple tried to release from the triangle but was quickly rejected.
Today, XRP price destroyed the triangle’s lower trend line and plummeted to the confluence of the April low at $0.874 and the 61.8% Fibonacci retracement of the rally originating at the beginning of 2021 at $0.856.
A close above the channel’s lower trend line at $1.312 would signal that the selling is complete, and the international settlement token will begin the new process of rallying to $2.00.
The potential of a positive resolution to the SEC case with Ripple, combined with rumors of an IPO following the case, has many investors focused on the all-time high at $3.30.
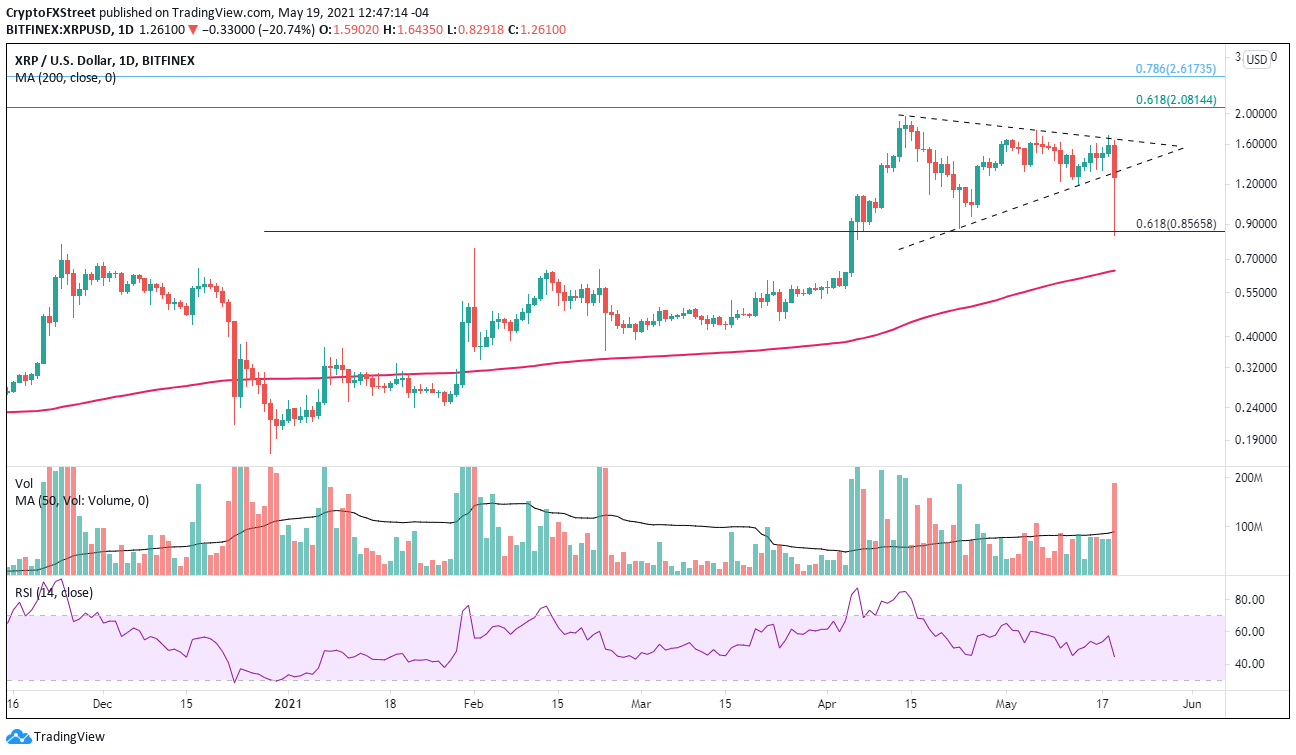
XRP/USD daily chart
Today’s sell-off in the cryptocurrency complex was a blunt reminder of the volatility and risks associated with the alternative digital tokens and how the power of contagion can overrun fortunes in a matter of hours.
Author

Sheldon McIntyre, CMT
Independent Analyst
Sheldon has 24 years of investment experience holding various positions in companies based in the United States and Chile. His core competencies include BRIC and G-10 equity markets, swing and position trading and technical analysis.




