XRP Price Prediction: Ripple fears of a major decline are unwarranted
- XRP price traction continues to be absent as the stress of the looming $0.76 support builds with each day.
- Ripple daily volume has not recorded one day above the 50-day average since May 23.
- SEC case still overshadows the digital asset, particularly in periods of price stress.

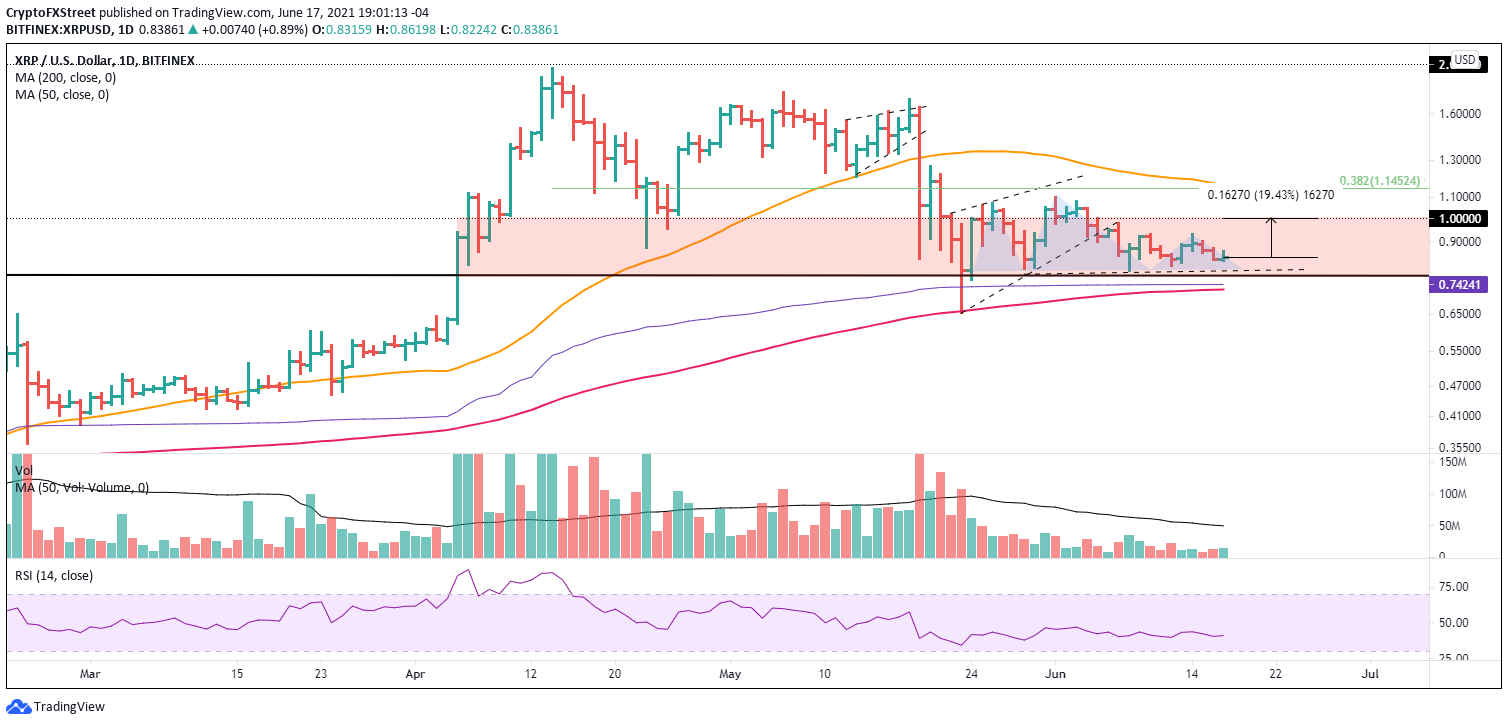
XRP price remains locked in a range between the psychologically important $1.00 and the neckline of a multi-year inverse head-and-shoulders pattern at $0.76. However, a lack of technical clues leaves frothy forecasts on the sideline until directional confirmation can be gleaned from the charts.
XRP price may be waiting for a collective improvement in altcoins
XRP price has displayed similar passiveness and lack of direction as most altcoins. Ripple was not inspired by the 30% rally in Bitcoin price, instead favoring to be range-bound between two intimidating levels, the neckline of an inverse head-and-shoulders pattern at $0.76 and $1.00.
The range has not been accompanied by any signs of accumulation or distribution, raising the probability that XRP price may remain locked in the governing price range for the foreseeable future.
With XRP price at an inflection point, it is imperative to consider both sides of the trade. On the long side, Ripple is clear of any obstacles until $1.00, creating a 20% gain for investors from the current price. In addition, a daily close above $1.00 would introduce new bullish opportunities and targets, including a rally to the confluence of the 38.2% Fibonacci retracement of the May correction at $1.14 with the declining 50-day simple moving average (SMA) at $1.16, yielding a gain of 37% from price at the time of writing.
Ripple investors should use pullbacks to the $0.76 support level to increase position sizes with an eye on maximizing portfolio gains. It provides a clear risk level if the trade goes against them.
XRP/USD daily chart
A bearish view of XRP price is complemented by a minor head-and-shoulders pattern with the neckline close to $0.76, bolstering the inflection point’s importance.
If the neckline and $0.76 break on a daily closing basis, Ripple investors can then consider bearish outcomes for XRP price. However, it is critical to note that standing in front of a test of the May 23 low at $0.65 is the union of the anchored volume-weighted average price (anchored VWAP) at $0.74 and the 200-day SMA at $0.72.
Nevertheless, the downside risk for XRP price appears limited to 20% from the current price. Not a highly persuasive argument for loading the portfolio with short positions.
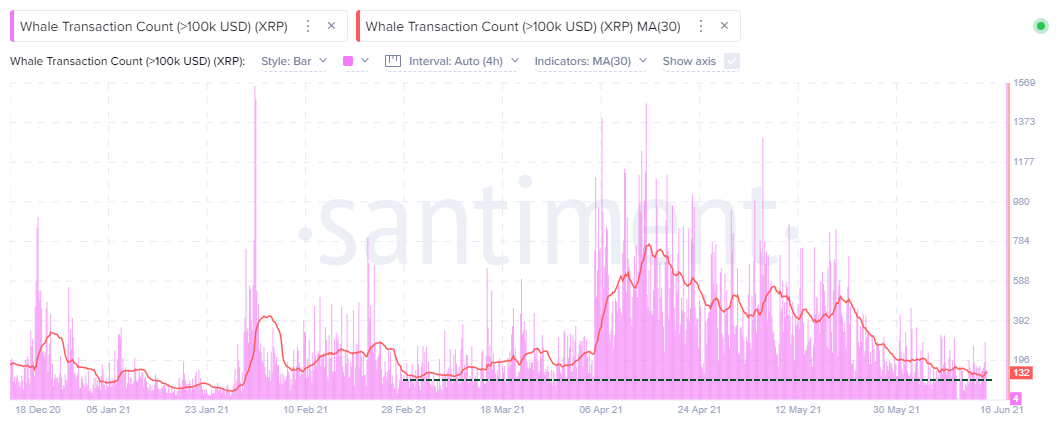
Advocating for a neutral view for XRP price and for investors to refrain from building sizeable short positions is the whale transaction count, which tracks transfers of $100,000 or more. In the past, jumps in the Ripple on-chain metric have matched important tops as large investors were liquidating their positions.
On a 30-day smoothed basis, the Santiment whale transaction count just tested the early March lows, suggesting that whale-driven selling pressure has been exhausted. If that is the case, XRP price downside should be limited to $0.76, or at most $0.72.
XRP Whale Transaction Count - Santiment
Ripple, unlike other altcoins, shows selling is exhausted within the whale investor category. Moreover, it is furnished with a stubborn range of support that should prove instrumental in sustaining XRP price if the cryptocurrency complex devolves into another collective sell-off. Hence, making headline-grabbing bearish predictions is unwarranted at this point.
Lastly, the importance of the SEC case against Ripple should not be dismissed in consideration of XRP price projections. Until there is a settlement, as most spectators anticipate, the digital asset will not go public and will not be available for trading on many major cryptocurrency exchanges. Both things are price negative while the case remains live.
In the following video, FXStreet’s analysts highlight two key price points for investors to consider.
Author

Sheldon McIntyre, CMT
Independent Analyst
Sheldon has 24 years of investment experience holding various positions in companies based in the United States and Chile. His core competencies include BRIC and G-10 equity markets, swing and position trading and technical analysis.