- XRP price hints at a reversal after a 30% rally in seven days.
- The hope that the lawsuit against Ripple may be coming to an end elicits interest from investors.
- A pullback seems imminent due to the absence of solid support areas.
XRP price is slowing down from its winning streak this week. The international money remittance token, issued by Ripple, jumped a whopping 75% from $0.3200 to $0.5615 between September 16 and September 23. XRP price successfully navigated a week characterized by numerous external forces related to inflation and the global economy.
Is the SEC vs. Ripple lawsuit coming to an end?
XRP price’s strong week stems from a growing investor interest – and optimism that the case Ripple faces against the Securities and Exchange Commission (SEC) may soon end. Ripple and the SEC filed motions for summary judgment to compel the judge to dismiss the case before trial and rule in their favor.
The SEC filed the case against Ripple Labs and its top executives in December 2020 for allegedly selling unregistered securities. Nearly two years after the filing, the lawsuit still drags on.
No one knows how the court will handle the motions for summary judgment. However, XRP price would benefit immensely if the ruling favored Ripple Labs. FXStreet recently reported that the two conflicting parties might soon have a window to agree on a settlement. Nevertheless, this is unlikely to be the outcome with the latest developments.
What’s next for XRP price?
The XRP community is extremely bullish following the development in court. On the other hand, XRP is doddering at $0.4901 after pulling back from its five-month high at $0.5615. The 200-day SMA (Simple Moving Average - purple) provides the payments token with immediate support.
As long as the 200-day SMA remains unbroken, investors won’t need to worry about losing the weekly accrued gains. However, a sell signal from the TD Sequential indicator reveals that selling pressure may be building, and a reversal is in the offing.
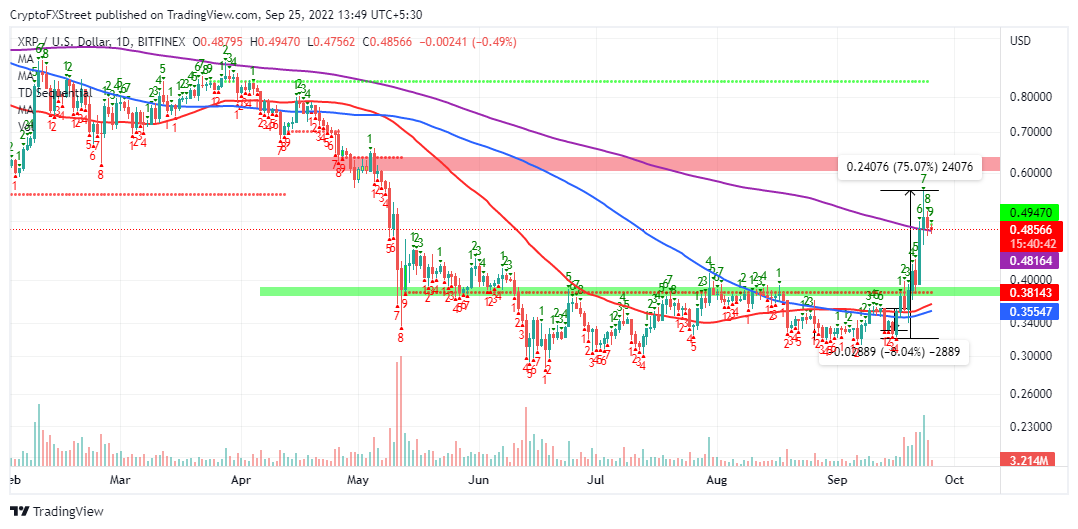
XRP/USD daily chart
The call to buy to XRP manifests in a green nine candlestick, but traders must confirm the actual sell order by checking whether the low of the sixth and the seventh candles in the count is exceeded by that of the eighth and ninth bars.
It is essential to remember that the bear market is still on – and so are the chances of a pullback. Traders looking for possible exit points should consider the 200-day SMA analyzed above. On the downside, new entries can be made around the resistance turned support at $0.3800.
Information on these pages contains forward-looking statements that involve risks and uncertainties. Markets and instruments profiled on this page are for informational purposes only and should not in any way come across as a recommendation to buy or sell in these assets. You should do your own thorough research before making any investment decisions. FXStreet does not in any way guarantee that this information is free from mistakes, errors, or material misstatements. It also does not guarantee that this information is of a timely nature. Investing in Open Markets involves a great deal of risk, including the loss of all or a portion of your investment, as well as emotional distress. All risks, losses and costs associated with investing, including total loss of principal, are your responsibility. The views and opinions expressed in this article are those of the authors and do not necessarily reflect the official policy or position of FXStreet nor its advertisers. The author will not be held responsible for information that is found at the end of links posted on this page.
If not otherwise explicitly mentioned in the body of the article, at the time of writing, the author has no position in any stock mentioned in this article and no business relationship with any company mentioned. The author has not received compensation for writing this article, other than from FXStreet.
FXStreet and the author do not provide personalized recommendations. The author makes no representations as to the accuracy, completeness, or suitability of this information. FXStreet and the author will not be liable for any errors, omissions or any losses, injuries or damages arising from this information and its display or use. Errors and omissions excepted.
The author and FXStreet are not registered investment advisors and nothing in this article is intended to be investment advice.
Recommended Content
Editors’ Picks

Crypto Today: SHIB, Pi Network and DOGE emerge as top gainers as Bitcoin crosses $2T market cap
Bitcoin price hits $105,800, claiming the $2 trillion valuation milestone, after US and China confirmed a temporary trade agreement to lower tariffs. Shiba Inu, Pi Network and Dogecoin emerge as top gainers among the 20 main crypto assets.

Dogecoin price 40% surge tests crucial resistance amid easing trade tensions
Dogecoin (DOGE) rally gains bullish momentum to exchange hands at $0.25 at the time of writing on Monday. Since the tariff-triggered crash on April 7, the largest meme coin by market capitalization has edged higher on easing trade tensions.

Bitcoin Price Forecast: BTC edges closer to all-time high as US-China trade deal cheers markets
Bitcoin price stabilizes around $104,000 on Monday after rallying 10.44% the previous week. Risk-on gains traction as the US and China agree to major tariff reductions for 90 days.

Sui eyes new record high as network redefines AI, gaming and DeFi
Sui price tests above $4.00 for the first time since early February, upholding a broad-based bullish momentum. Sui is crafting a new ecosystem, redefining how builders and users interact with AI, Gaming and DeFi.

Bitcoin: BTC bulls aim for $105,000 after nearly 10% weekly gains
Bitcoin price stabilizes around $103,000 on Friday after rallying nearly 10% this week. Risk-on sentiment prevails as Trump announced a trade deal with the UK and ahead of the meeting with China this weekend.