XRP Price Prediction: A case of sneaky divergence
- XRP price prints a sneaky bearish divergence pattern on the daily chart.
- Ripple price retraces the historical trend with an uptick in transactions on the Volume Profile Indicator.
- Invalidation of the macro bearish outlook remains a breach above $0.48.

Ripple price prints a sneaky bearish divergence pattern that should not be taken lightly.
The ripple price looks dicey
Ripple price shows reasons to remain concerned. On July 26, 2022, a warning was issued as the Ripple price was rejected from a historical trend line dating back to April 2021. The classical price action signature resembles textbook catalyst makers. Based on Elliot Wave and Fibonacci projections, a $0.24 target has been forecasted.
On July 27, the Ripple price retraced the historical barrier with an uptick in volume and a huge bullish engulfing candle. Additionally, a 3-day morning star pattern is displayed on the daily chart, which will entice traders to look for bullish targets above.
XRP price currently auctions at $0.34. The main concern surrounding the digital remittance token is where it lies in terms of a macro count. Ripple price is still in a steep downtrend since April of 2021 and has not retraced 38-50% of the decline.
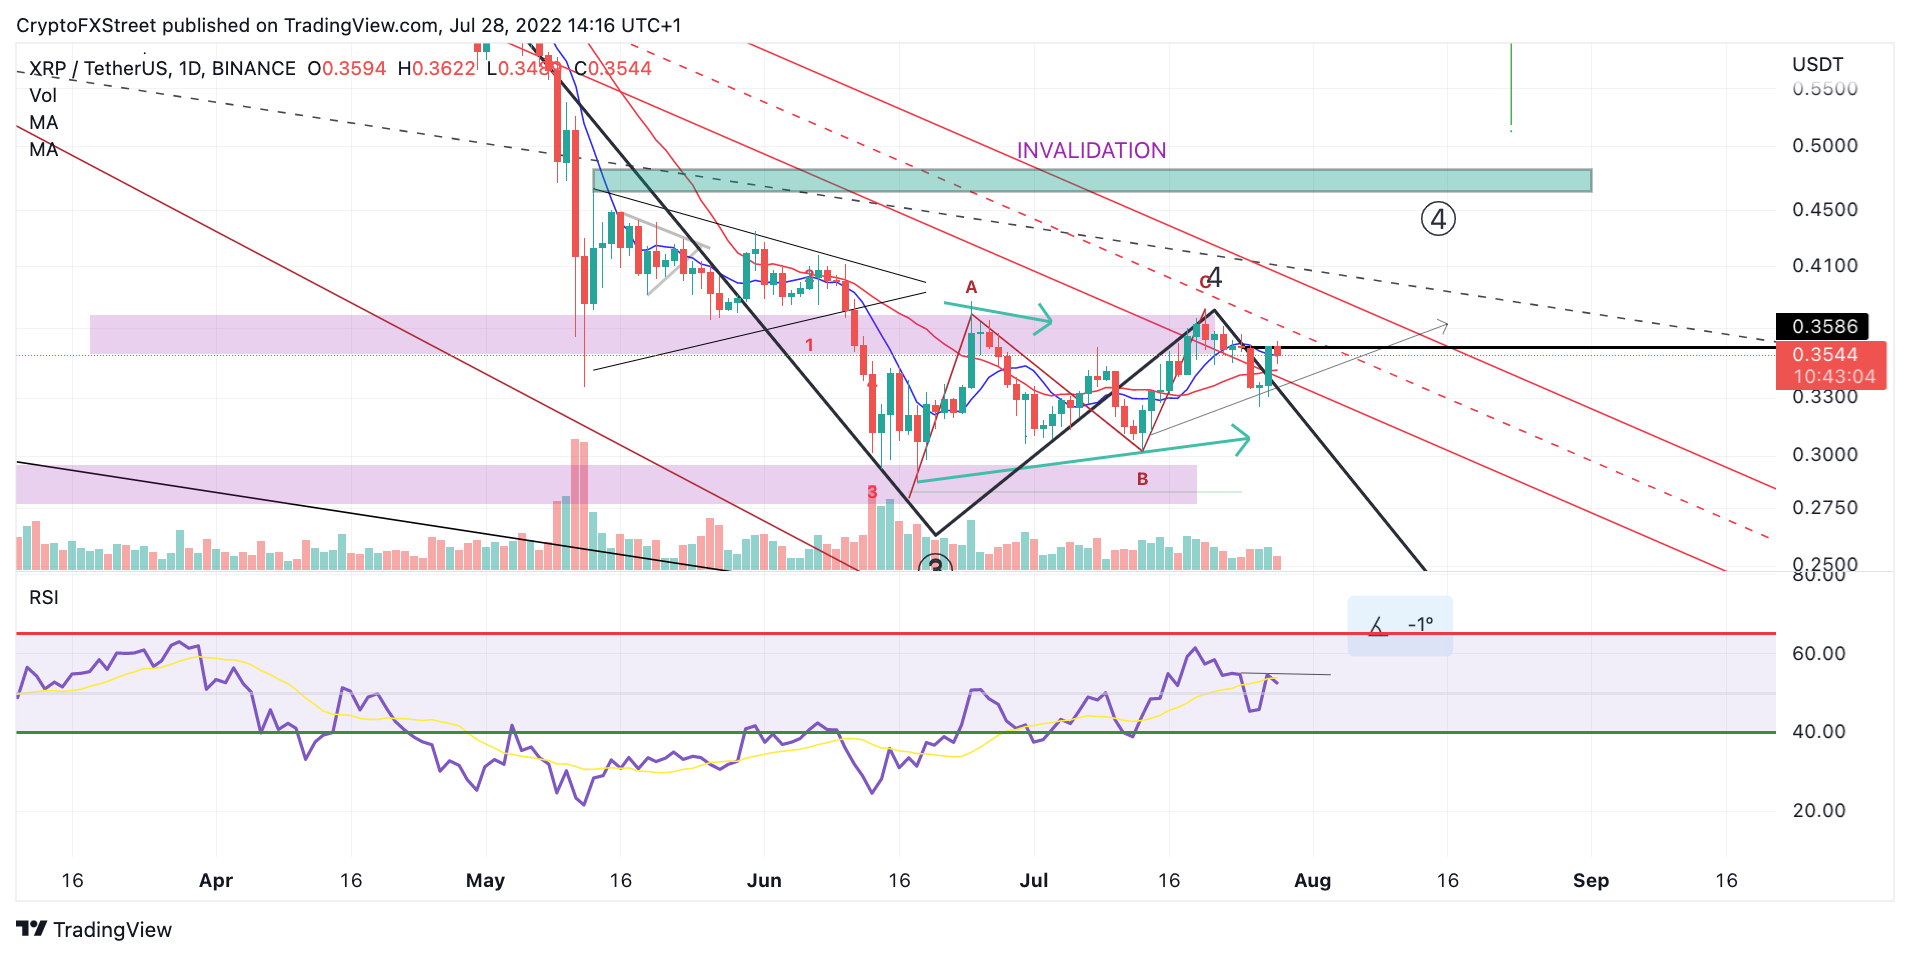
XRP/USDT 1-Day Chart
Everyone wants to catch the bottom in hopes of maximizing profits on the ride back up. There is no doubt that Ripple’s XRP token will be a $2.00, $5.00 and even $10.00 token someday. But right now, the move is still quite dangerous and can severely damage one’s opportunity cost.
On June 26, the Relative Strength Index confounds this idea very subtly. The bearish divergence spotted between June 24, and June 27 should not be taken lightly. If the technicals are correct, a steep decline will be the only way to resolve the divergence unless the Ripple price can rally through the macro invalidation point at $0.48. This scenario may be too risky for long-term investors. Staying sidelined and missing out on the initial 30% rally towards $0.48 is justifiable.
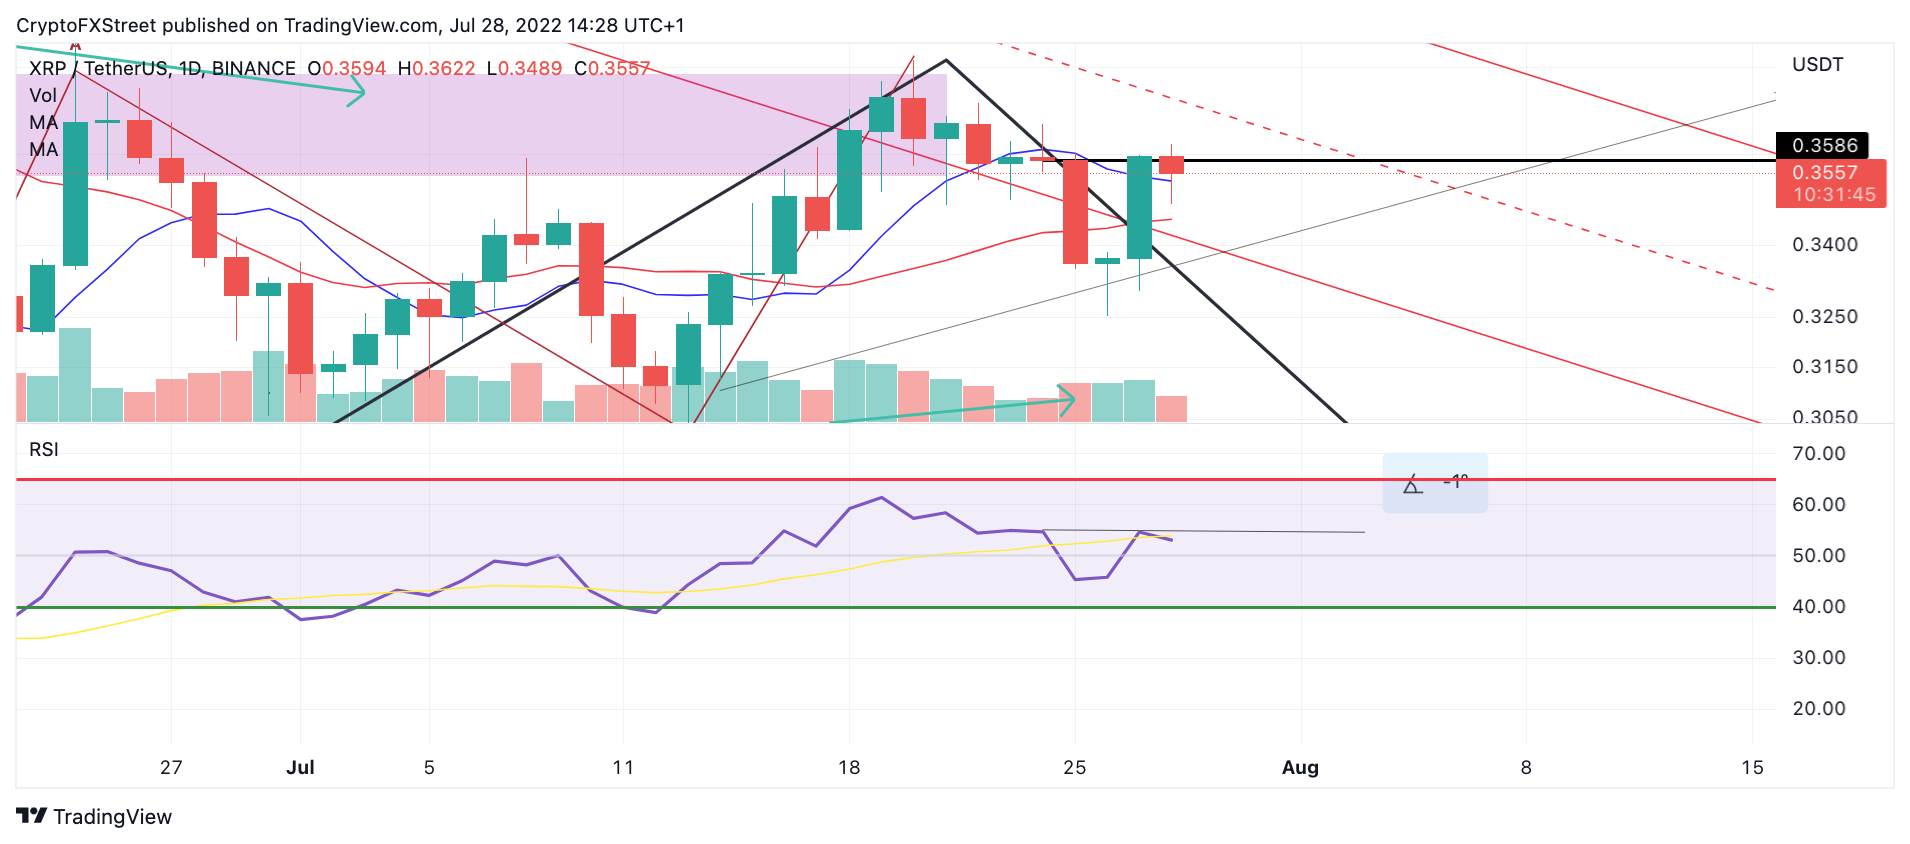
XRP/USDT 1-Day Chart
Subtle bearish divergences on the daily chart are usually the last chance before sharp liquidations occur. $0.24 is the first target, but the XRP price could continue in an extended decline targeting $0.17 for up to a 50% decline in price.
Bullish targets based on the morning star pattern should be considered short-term plays as the risk of a sharp decline will remain in the cards until $0.48 is breached.
In the following video, our analysts deep dive into the price action of Ripple, analyzing key levels of interest in the market. -FXStreet Team
Author

Tony M.
FXStreet Contributor
Tony Montpeirous began investing in cryptocurrencies in 2017. His trading style incorporates Elliot Wave, Auction Market Theory, Fibonacci and price action as the cornerstone of his technical analysis.


