XRP price on the cusp of massive decline if this critical support level fails to hold
- XRP price is sitting above a key support level amid a prevailing downtrend.
- If Ripple fails to hold above $1.07, the token may see further decline toward under $1.00.
- The governing chart pattern suggests that XRP price could plunge 9% toward $0.97.

XRP price is trapped within a recent downtrend as the momentum has flipped to the downside. Ripple lagged behind while other cryptocurrencies, including Bitcoin and Ethereum, recently witnessed rallies reaching new all-time highs. If the cross-border remittance token fails to hold one crucial foothold, it could continue to edge lower.
XRP price at risk of 9% decline
XRP price has formed a descending parallel channel pattern on the daily chart since October 9, printing lower highs and lower lows, unable to escape the governing downtrend.
Ripple is in danger of further decline as XRP price is edging closer toward the ascending support trend line that started forming on July 20.
However, XRP price will be able to discover meaningful support at $1.07, where the 50-day Simple Moving Average (SMA), the ascending support trend line, the middle boundary of the prevailing chart pattern, and the 61.8% Fibonacci retracement level meet. Ripple must hold and close above this level to avoid further losses.
The Arms Index (TRIN), an indicator that gauges overall market sentiment suggests that there is slightly higher selling activity than buying activity. This could indicate that bulls could continue struggling to lift prices higher against the overpowering distribution of the sellers.
If selling pressure continues to rise, XRP price may slice below the ascending support trend line, exposing Ripple to additional downside risk, dropping toward the 200-day SMA at $1.02. The token may find a foothold at the 100-day SMA at $0.99, before dropping toward the bearish target given by the governing chart pattern, at the lower boundary of the parallel channel at $0.97.
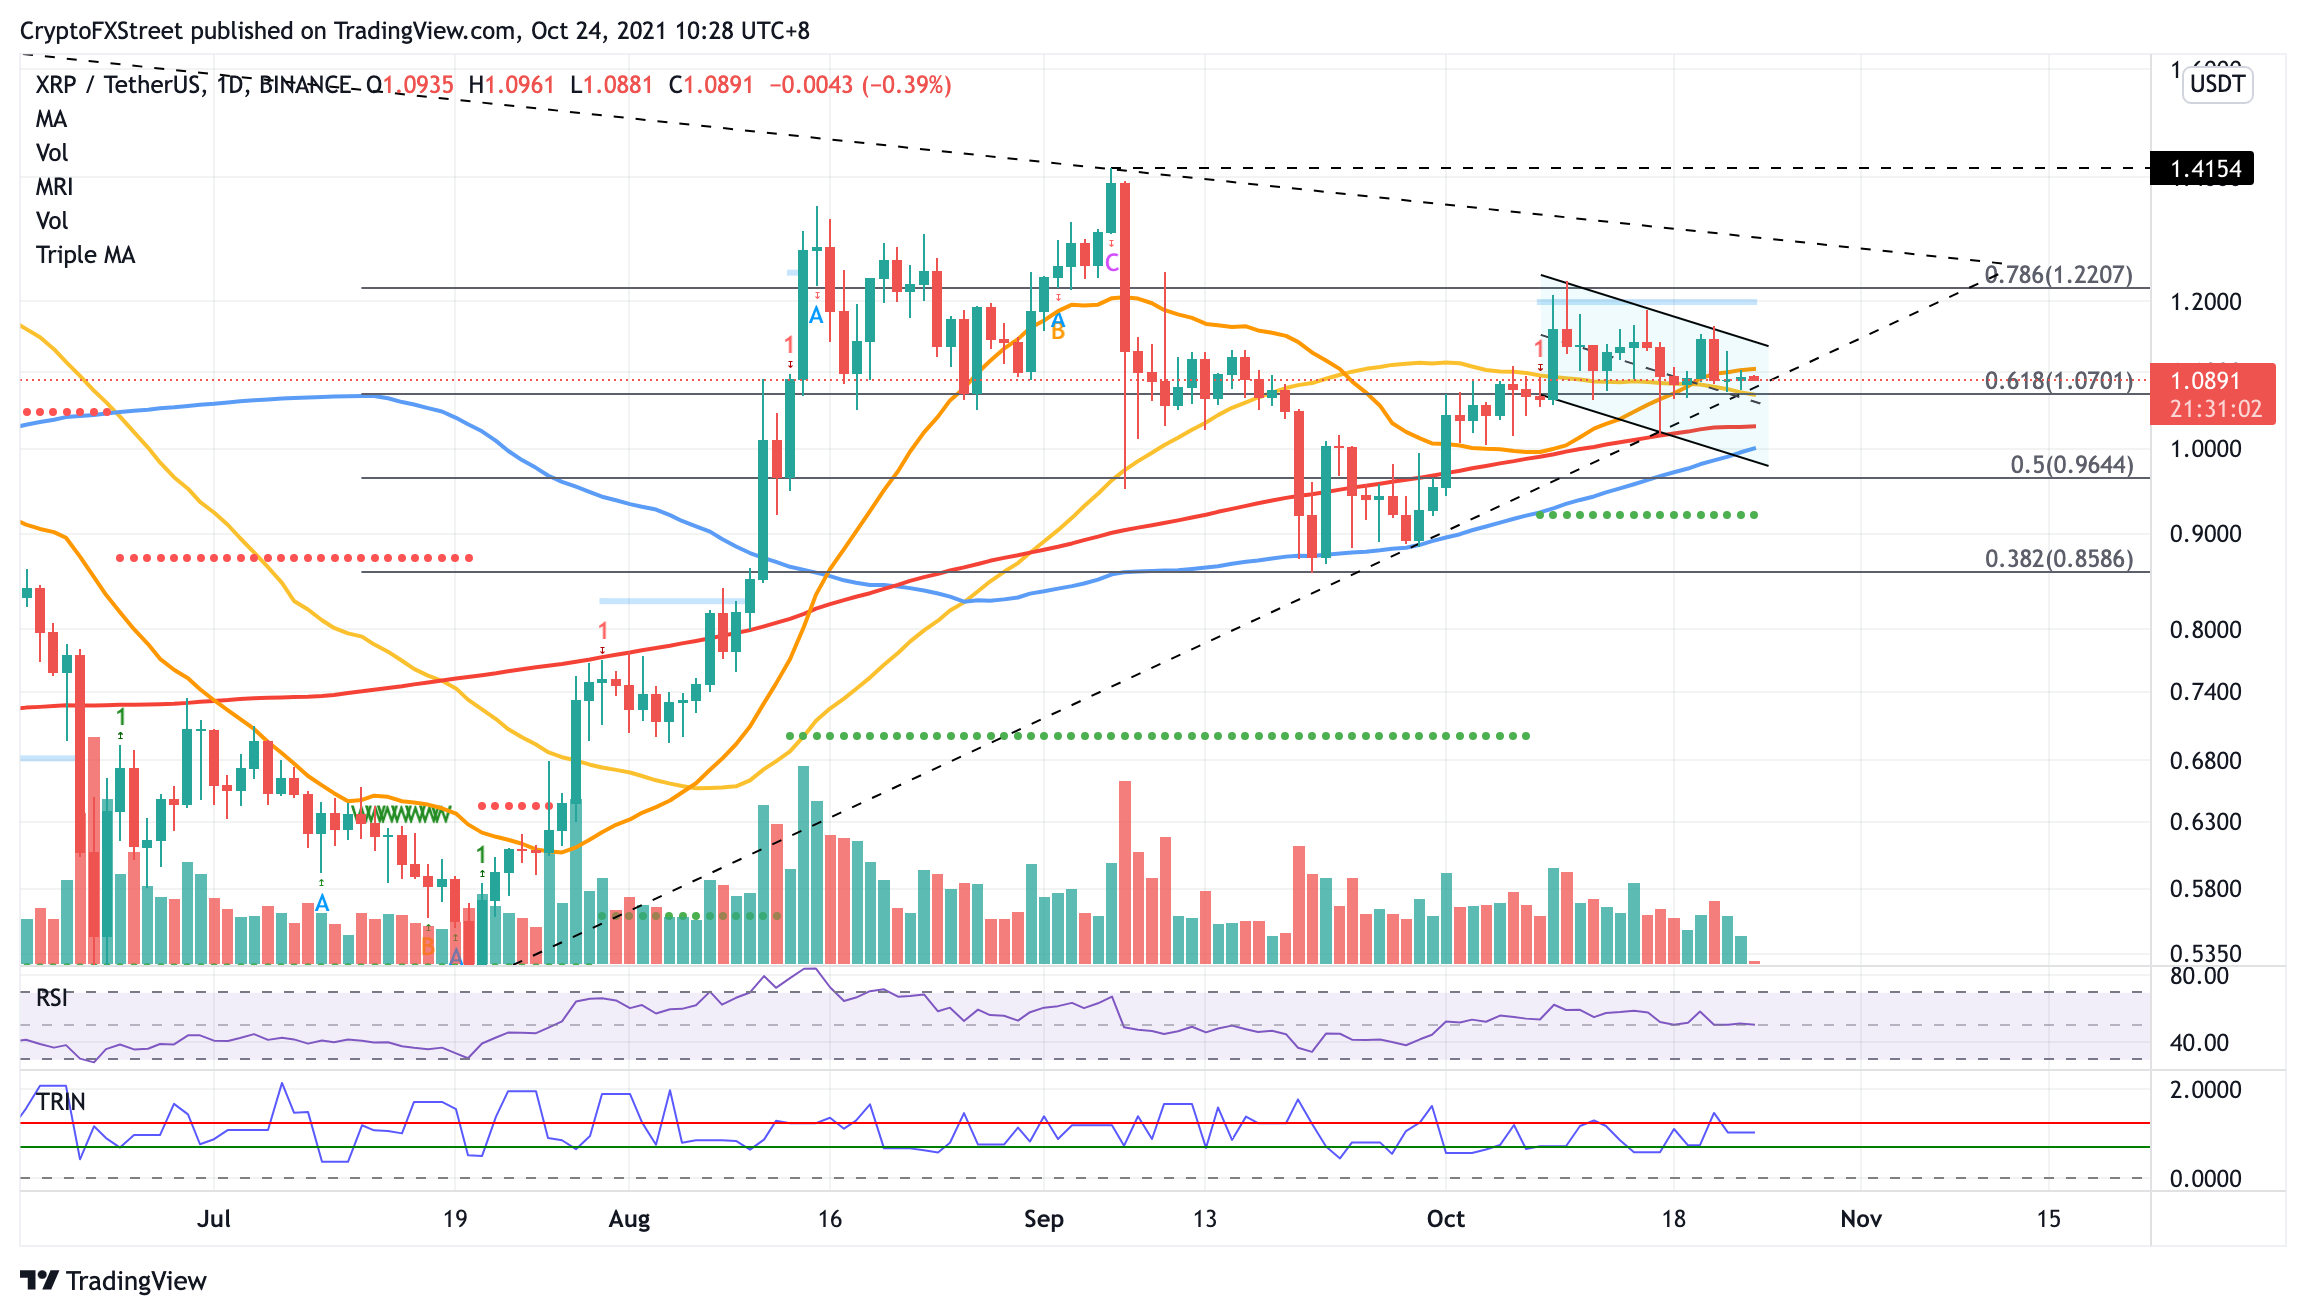
XRP/USDT daily chart
Further bearish sentiment may incentivize XRP price to slide toward the 50% Fibonacci retracement level at $0.96, then to the September 21 low at $0.85, coinciding with the 38.2% Fibonacci retracement level.
If Ripple bulls manage to reverse the period of underperformance, XRP price will meet its first obstacle at the 21-day SMA at $1.10, then at the upper boundary of the parallel channel at $1.13. The following target for buyers is at the 78.6% Fibonacci retracement level at $1.22. However, investors should note that only a close above the 21-day SMA would signal the token’s resilience from its recent weakness.
Author

Sarah Tran
Independent Analyst
Sarah has closely followed the growth of blockchain technology and its adoption since 2016.


