Top 3 Price Prediction Bitcoin, Ethereum, XRP: Crypto bulls unfazed by flash crash
- Bitcoin price action initially shakes off strong selling pressure, finds buyers at support, then resumes some selling pressure.
- Ethereum price action mixed post-all-time high rejection.
- XRP price awaits its own bullish breakout and an opportunity to outperform its peers.

Bitcoin price closed more than 5% lower on the Thursday session, but buyers have stepped in to hold the Tenkan-Sen as support. Ethereum price action shows that the recent rejection has caused some indecision. XRP price does not have far to move to initiate a massive bullish breakout.
Bitcoin price continues to find buyers at the Tenkan-Sen
Bitcoin price has shown resilience and conviction since creating new all-time highs. There were broad concerns that due to Ethereum’s rejection of new all-time highs, Bitcoin might suffer a robust corrective move below the $60,000 value area. Although the Binance.US exchange did have an anomalous wick that saw Bitcoin return to the $8,000 level –that was the exception. If buyers can maintain the Tenkan-Sen as a primary support zone, then a move to test $70,000 is next.
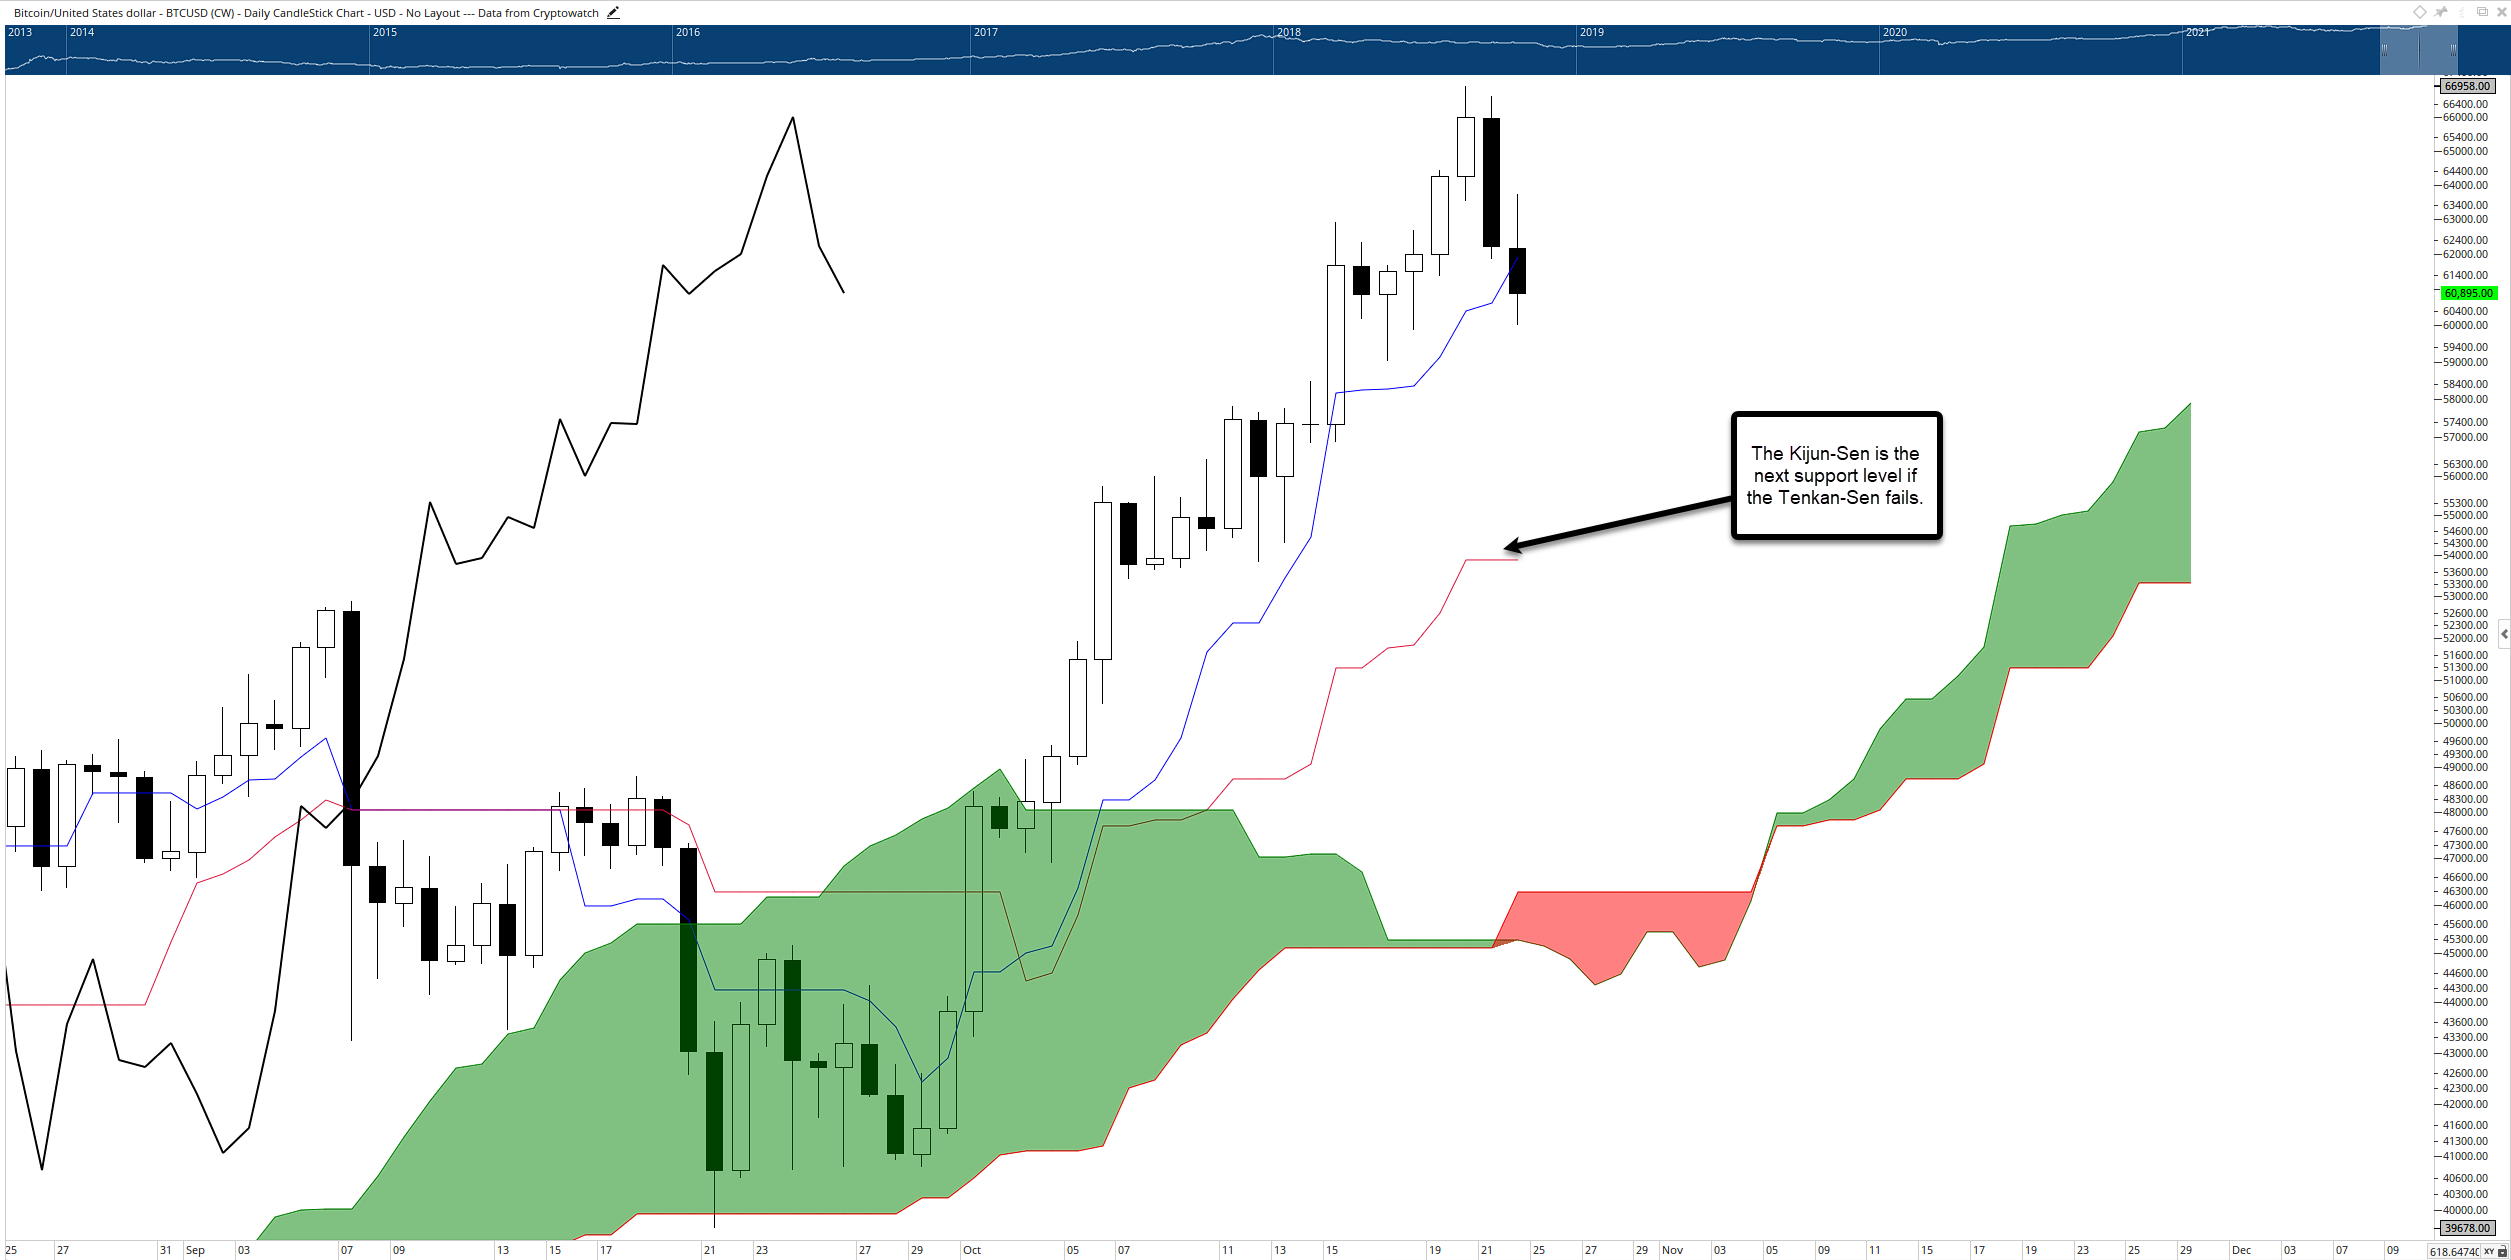
BTC/USD Daily Ichimoku Chart
Market participants should be wary of the weekend. Weekends are notorious for whipsaws in price action and major sell-offs, especially on Sunday. Watch for sustained breaks below the Tenkaan-Sen to test the Kijun-Sen near the $55,000 value area.
Ethereum price may trap short-sellers if bulls push higher
Ethereum price action was almost comical during the Thursday trade session, with sellers preventing Ethereum from making new all-time highs by just $2.70 (depending on the exchange data). Even though Ethereum closed 7% below the Thursday high and 2.5% below the open, buyers at first appeared undeterred. Some weakness and selling pressure have been observed during the New York lunch hour. Like Bitcoin, Ethereum has found buyers near the Tenkan-Sen. If bulls can hold the daily close above the Tenkan-Sen, another test of new all-time highs appears inevitable.
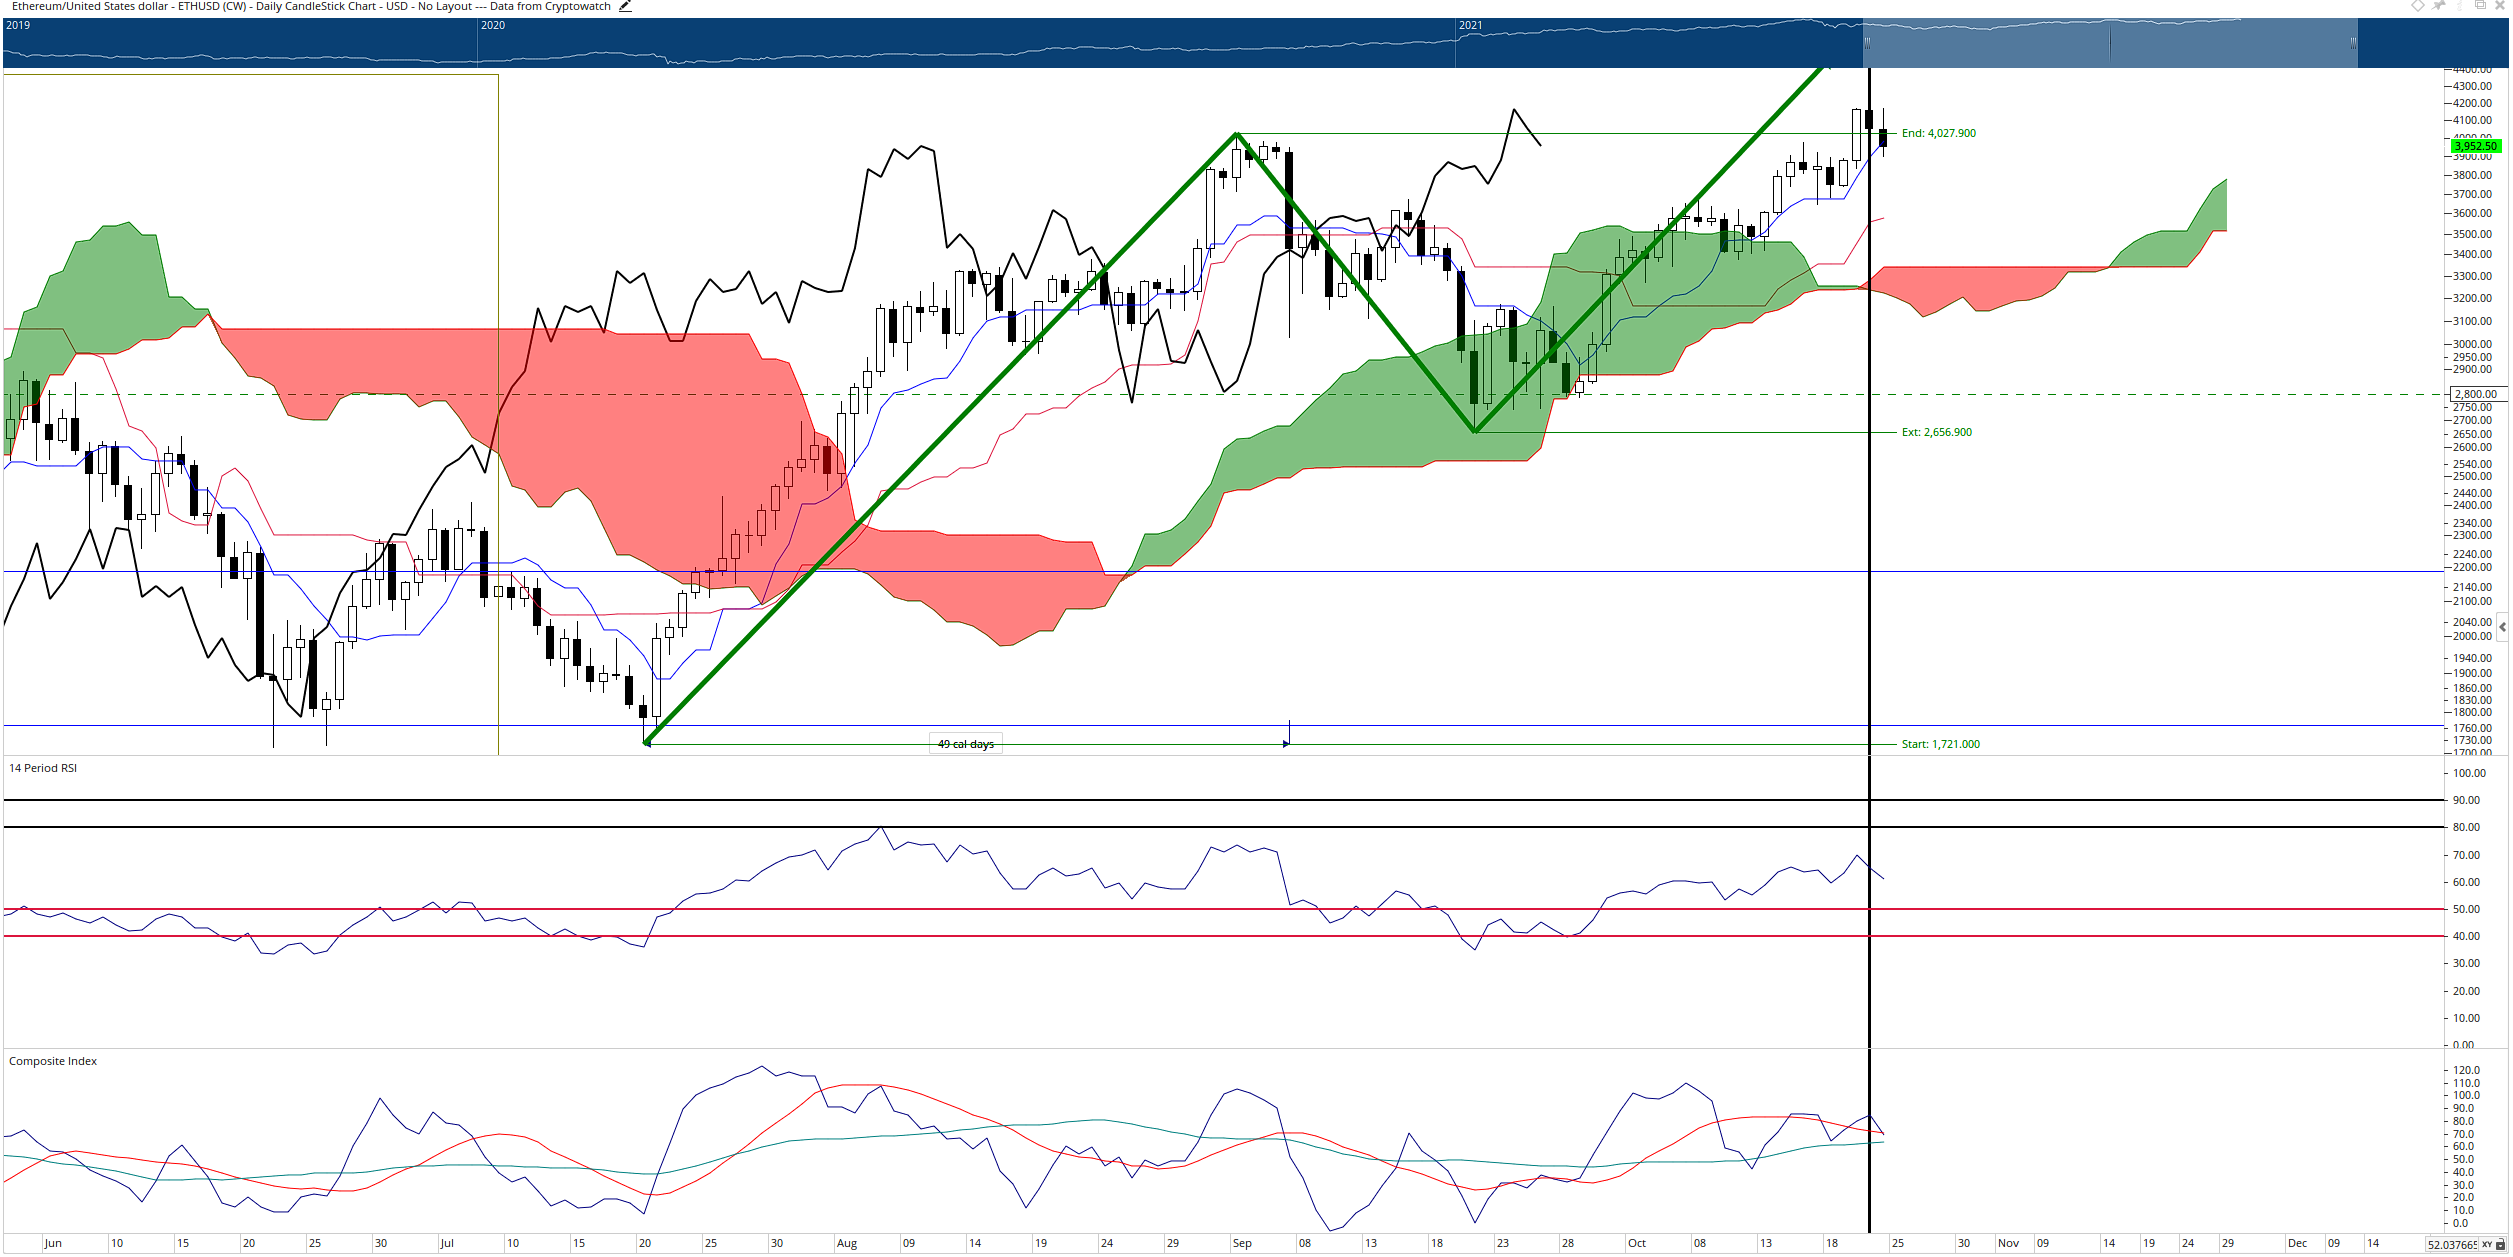
ETH/USD Daily Ichimoku Chart
However, watch for signs of selling pressure as the weekend approaches. The black vertical line represents where the nearest Kumo Twist (when Senkou Span A crosses above or below Senkou Span B) is located. Kumo Twists often mark turning points for markets that have been trending strongly at the time of the Twist. Thus, the upcoming weekend would be a perfect opportunity for short-sellers to push Ethereum price lower to test Kijun-Sen at $3,575 or Senkou Span B at $3,350.
XRP price action frustrates bulls and bears
XRP price has spent the past two weeks trading in a very constricted trading range. The bodies of the daily candlesticks have been limited to $1.08 on the low side and $1.16 on the high side. From an Ichimoku perspective, XRP has fulfilled all conditions to confirm an Ideal Bullish Ichimoku Breakout – buy buyers need to step in and push Ripple higher. A close at or above $1.17 would likely be sufficient for XRP to begin a 50% upswing towards the $1.60 - $1.70 value area.
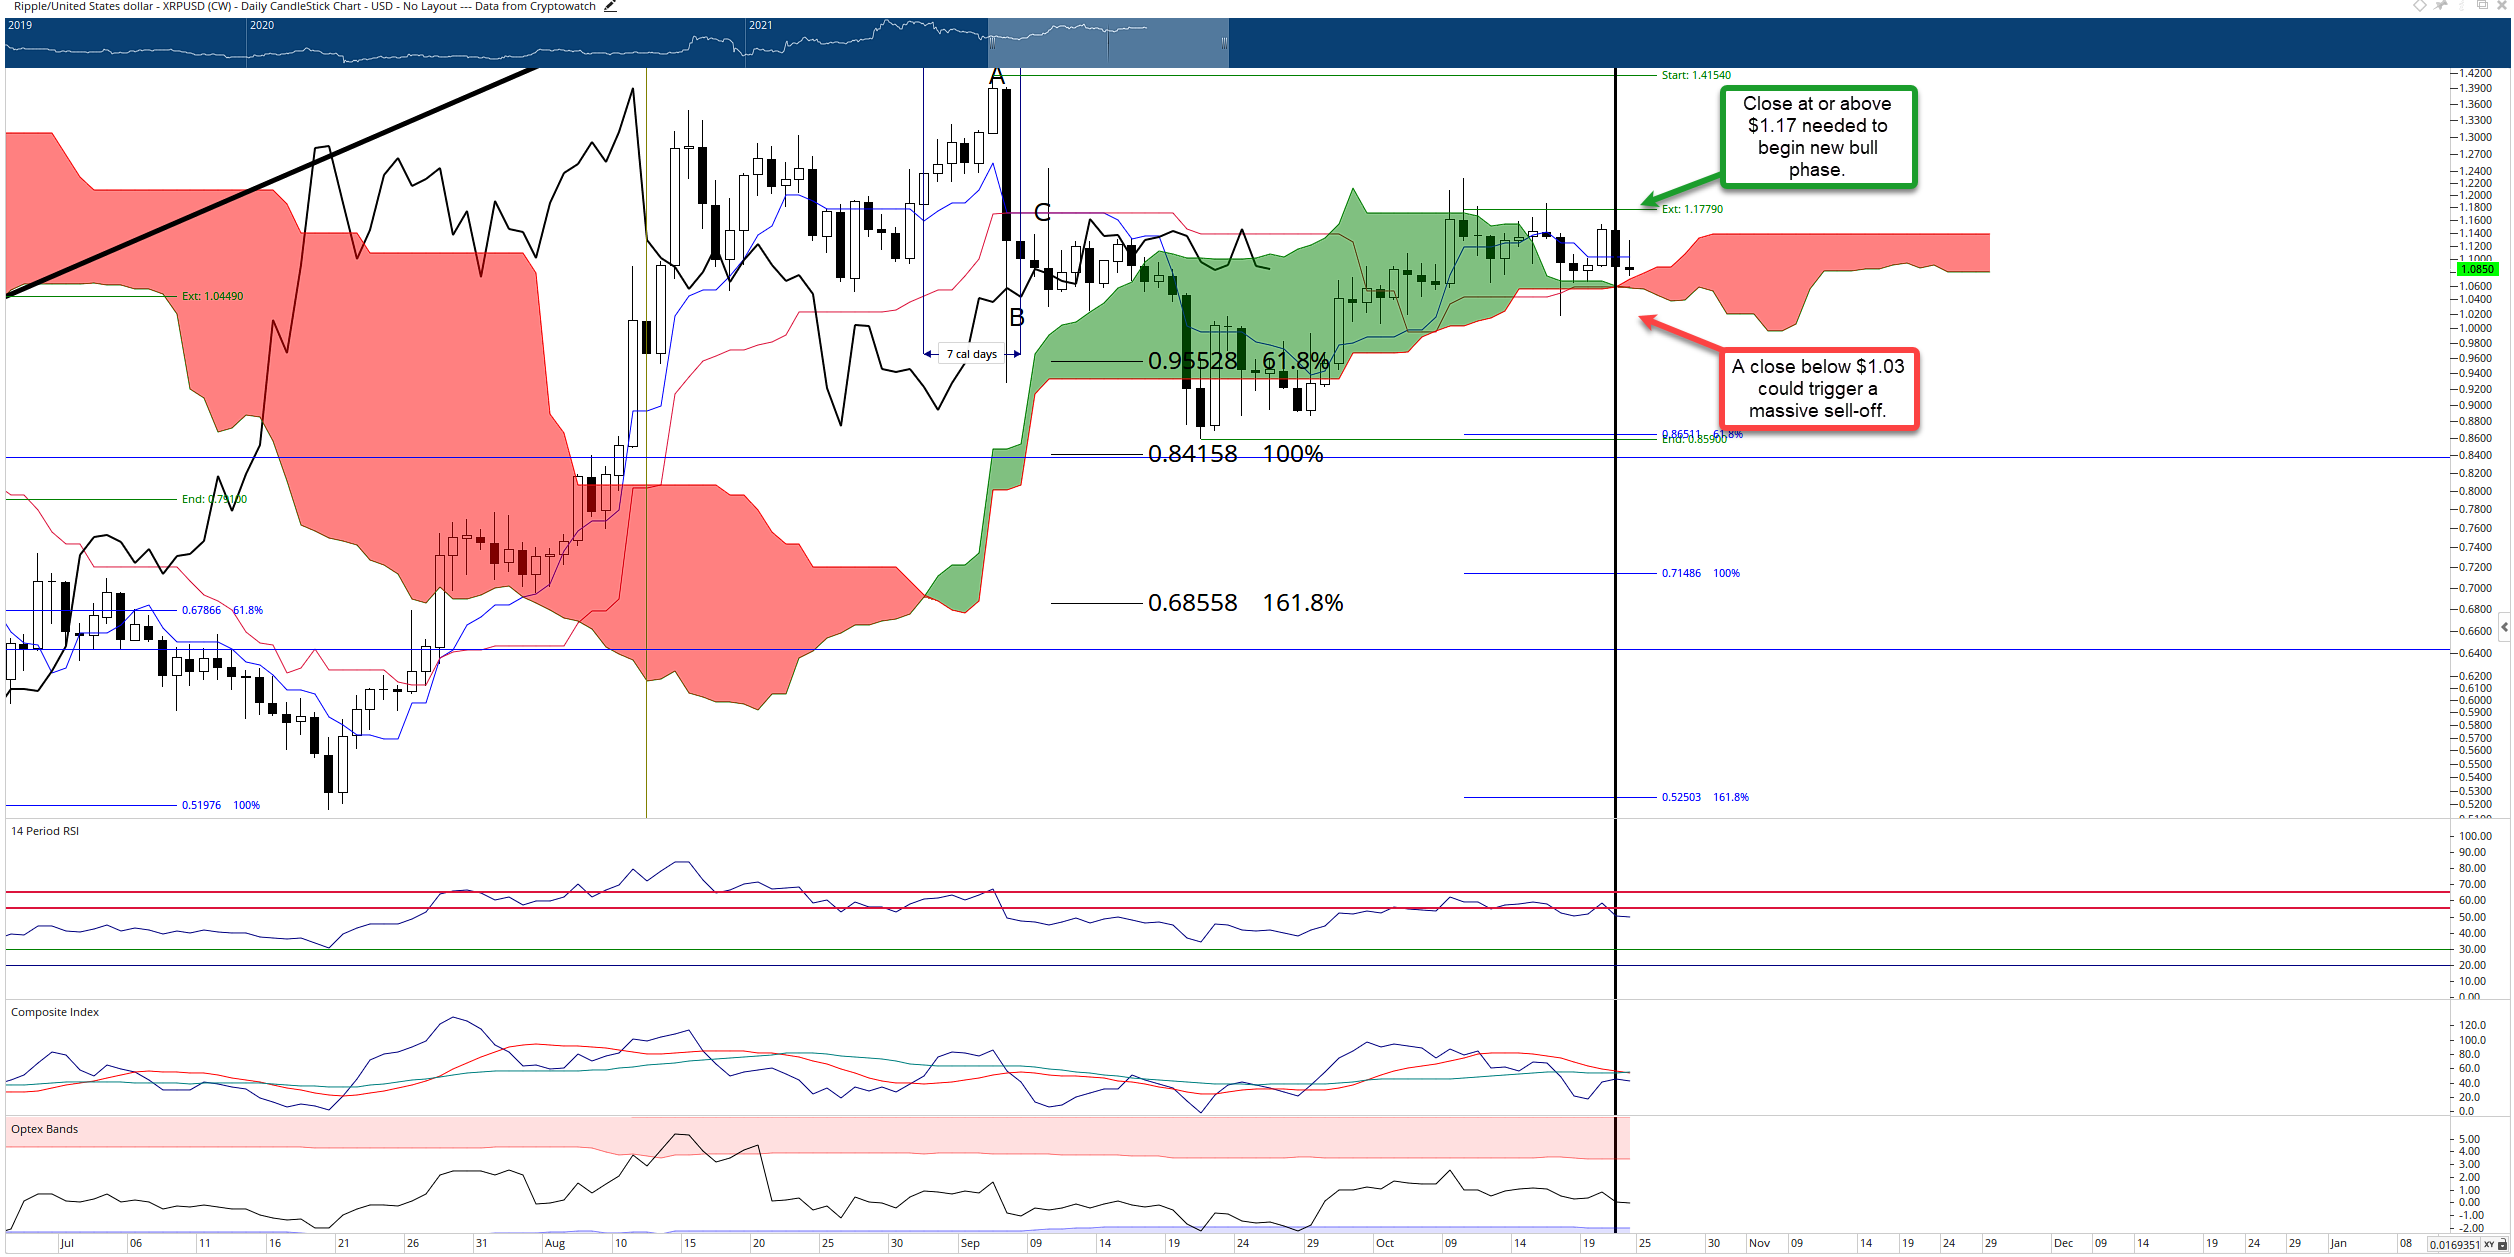
XRP/USD Daily Ichimoku Chart
As the weekend approaches, bulls will want to be cognizant of any strong push south which could cause a daily close below the Cloud. A close at or below $1.03 could be an early warning sign of some imminent selling pressure. If sellers were to push XRP price low enough to cause the Chikou Span to close below the candlesticks ($0.88), then a brand new bear market would likely begin for XRP.
Author

Jonathan Morgan
Independent Analyst
Jonathan has been working as an Independent future, forex, and cryptocurrency trader and analyst for 8 years. He also has been writing for the past 5 years.



