|

XRP price enters consolidation, Ripple at risk of plunging 48%

  • XRP price has witnessed its momentum flip to the downside following recent weakness.
  • Ripple could be awaiting a 48% plunge as the token nears a critical line of support.
  • The prevailing chart pattern projects a bearish target at $0.38.

XRP price has continued to set lower highs as Ripple failed to galvanize investors’ enthusiasm. The cross-border remittance token could now be at risk of a sharp decline if it slices below a critical line of defense. 

XRP price risk skewed to the downside

XRP price has formed a symmetrical triangle on the daily chart, as Ripple continues to consolidate. Although the prevailing chart pattern confuses forecasts, the token could be at the edge of a 48% plunge toward $0.38.

If XRP price slices below the lower boundary of the governing technical pattern at $0.72 that acts as crucial support, the aforementioned bearish target given by the prevailing chart pattern could be in the offing.

The first line of defense for XRP price following a break below $0.72 is at the 78.6% Fibonacci retracement level at $0.68, then at the July 28 low at $0.63, coinciding with the multi-month support trend line.

If selling pressure continues to increase, XRP price may drop toward the June 26 low at $0.58, then to the June 23 low at $0.52. Ripple may be able to find reliable support at the 127.2% Fibonacci retracement level at $0.48 before the bears attempt to reach the pessimistic target.

XRPUSDT

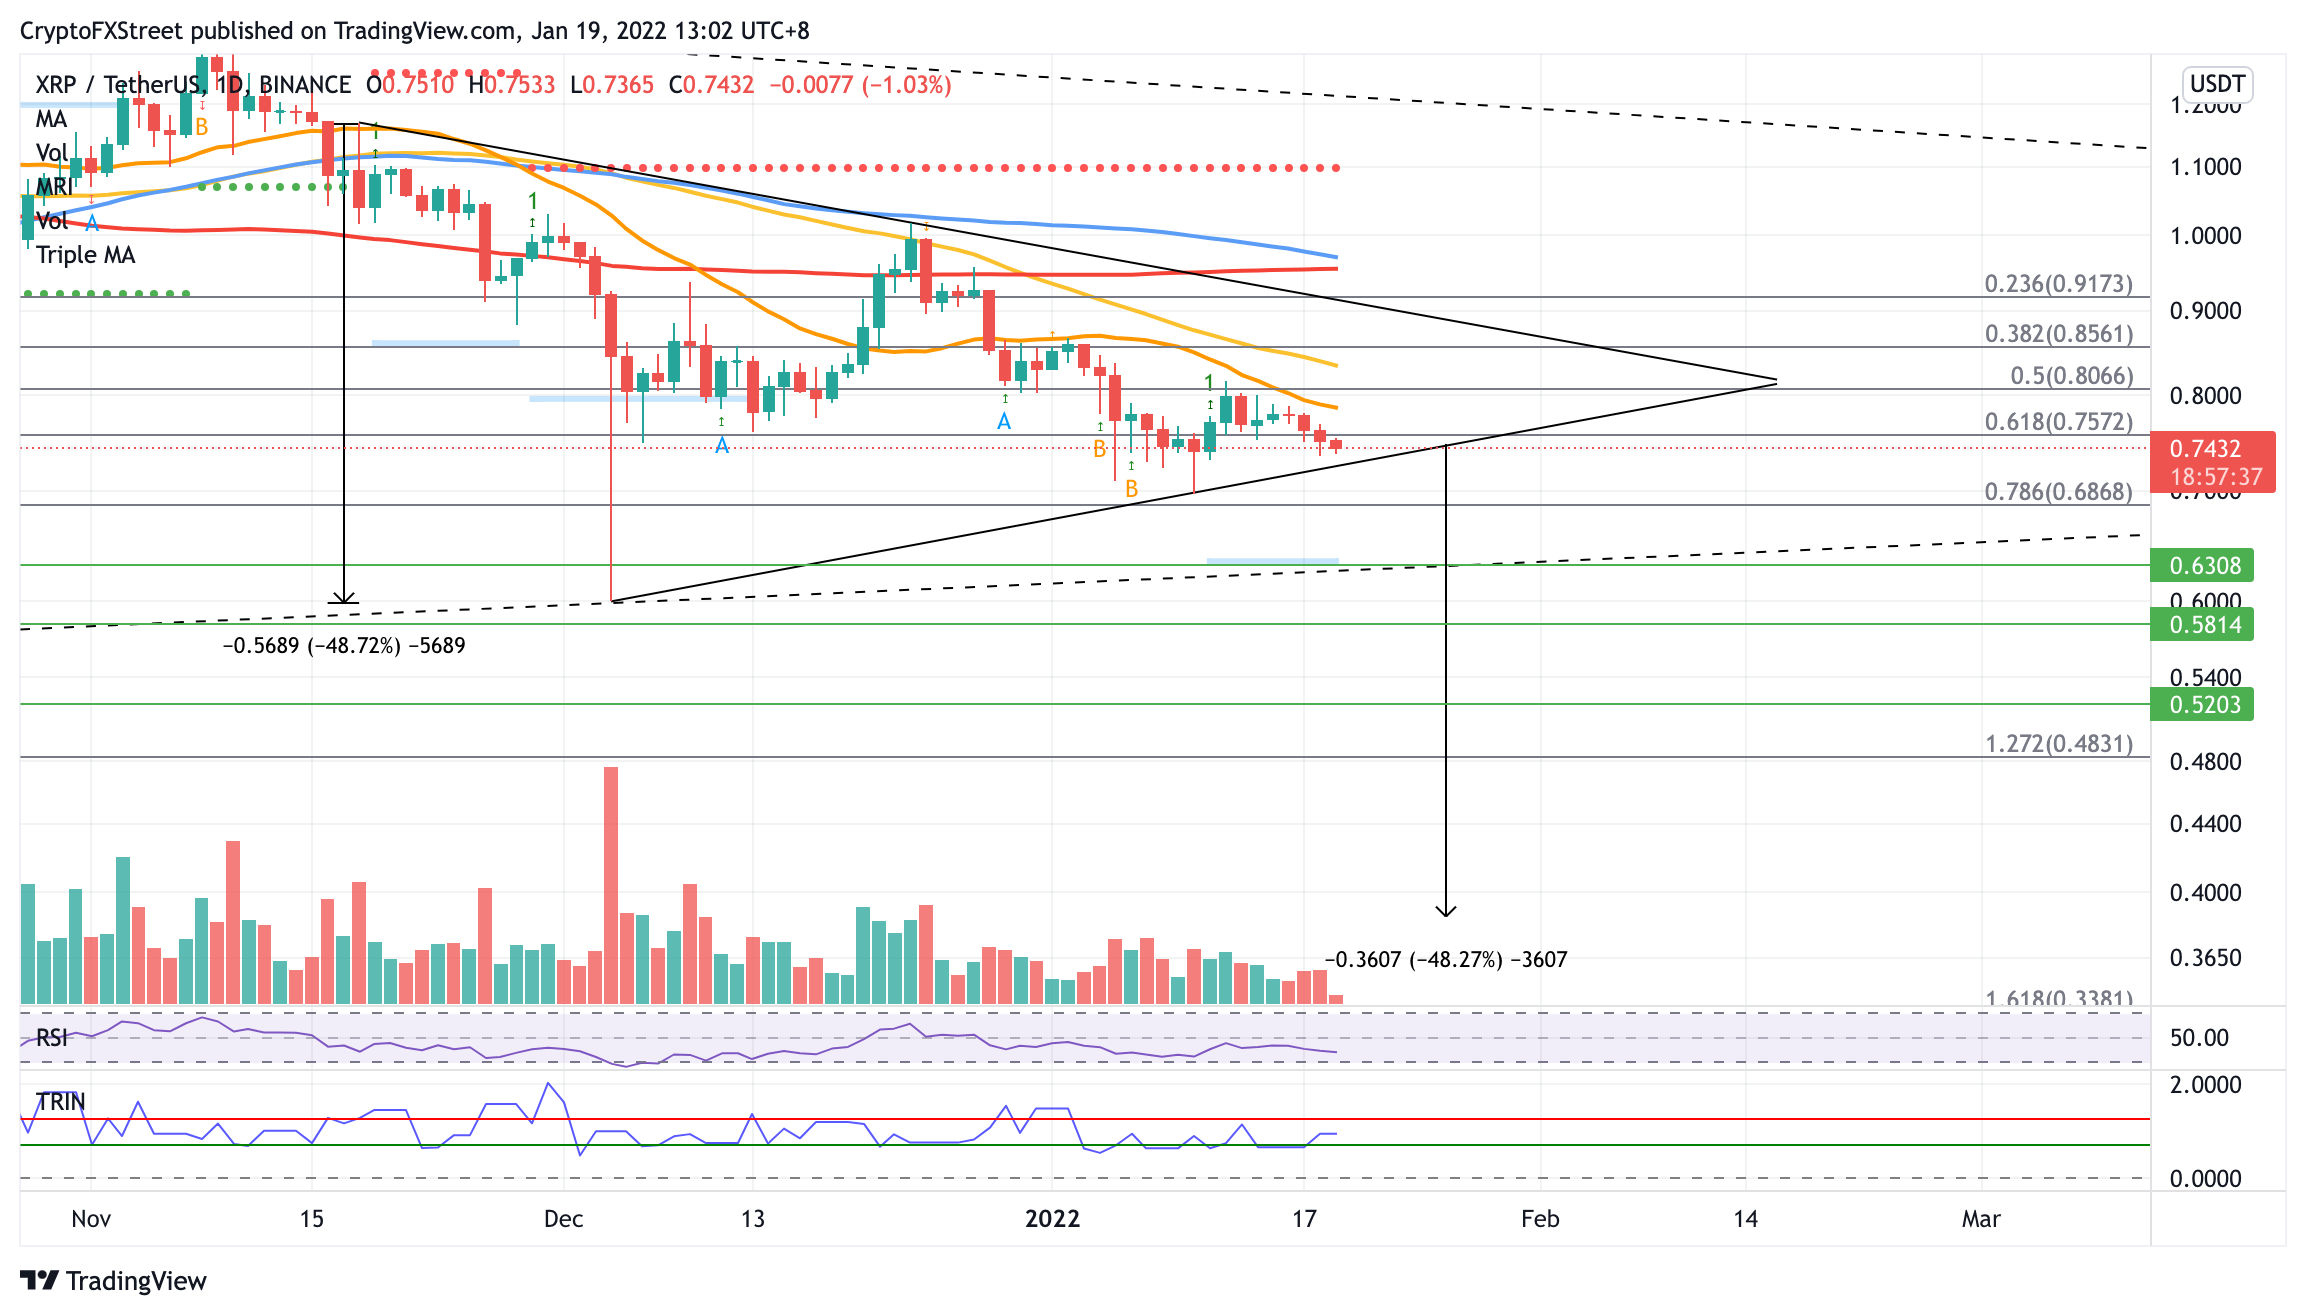
XRP/USDT daily chart

However, if the bulls manage to reverse the period of underperformance, Ripple will meet immediate resistance at the 61.8% Fibonacci retracement level at $0.75. Additional headwinds may emerge at the 21-day Simple Moving Average (SMA) at $0.78, then at the 50-day SMA at $0.83. 

Bigger aspirations will target the upper boundary of the symmetrical triangle pattern at $0.90. Investors should note that a break above the topside trend line of the prevailing chart pattern could release a 48% climb for XRP price. If buying pressure continues to rise, Ripple would encounter obstacles at $0.96, where the 100-day SMA and 200-day SMA intersect.

Author

Sarah Tran

Sarah Tran

Independent Analyst

Sarah has closely followed the growth of blockchain technology and its adoption since 2016.

More from Sarah Tran
Share:

Markets move fast. We move first.

Orange Juice Newsletter brings you expert driven insights - not headlines. Every day on your inbox.

By subscribing you agree to our Terms and conditions.

Editor's Picks

XRP edges lower despite record on-chain activity and steady ETF inflows

Ripple is trading under pressure at the time of writing on Thursday, after bulls failed to break the short-term resistance at $2.22. The reversal may extend toward Monday’s low of $1.98, especially if risk-off sentiment persists in the broader cryptocurrency market.

Aster lags recovery as perpetual DEX releases new roadmap on infrastructure, utility and ecosystem 

Aster is consolidating above $1.05 at the time of writing on Thursday, reflecting lethargic sentiment in the broader cryptocurrency market. The token native to the perpetual Decentralised Exchange had recovered from Monday's low of $0.88 but stalled around $1.08 on Wednesday.

Hyperliquid Price Forecast: Bulls aim breakout as RSI and MACD flash buy signal

Hyperliquid struggles to surface above $35 as a local resistance trendline caps the two-day recovery run. Hyperliquid Strategies Inc. (PURR) transfered 12 million HYPE tokens to Hypercore and staked 425,000 tokens, which reflects confidence. 

Cardano builds recovery momentum as sentiment improves

Cardano is extending its recovery for the second consecutive day, trading at around $0.4400 at the time of writing on Thursday. If this recovery leg from Monday's $0.3707 level steadies in the coming days, Cardano bulls could push toward a bullish December.

Orange Juice Newsletter – Smart insights by real people. Every day.

A free newsletter highlighting key market trends to help traders stay a step ahead. Daily insights on the most relevant trading topics, compiled by our experts in an easy-to-read format so you never miss an important move.

Bitcoin: BTC steadies as data suggests local bottom

Bitcoin (BTC) hovers around $91,000 at the time of writing on Friday, extending its recovery by 5% so far this week. On the institutional front, a modest outflow from US-listed spot Bitcoin Exchange Traded Funds (ETFs) marks a slowdown from previous weeks and signals a reduction in selling pressure, further supporting BTC’s recovery.