Top 3 Price Prediction Bitcoin, Ethereum, Ripple: Altcoins due for massive gains as BTC holds its ground
- Bitcoin price rejuvenates its uptrend as it bounces off a 4-hour demand zone, extending from $41,843 to $42,707.
- Ethereum price produces a higher high, signaling a continuation of its uptrend.
- Ripple price revisits the demand zone, ranging from $0.694 to $0.753, as bulls fail to kick-start a rally.

Bitcoin price reveals a bullish outlook albeit a slow one, providing altcoins with an opportunity to run free. The past week is a testament to the recent gains witnessed among many altcoins. While Ethereum continues to remain bullish, Ripple struggles to hold on.
Bitcoin price pushes forward
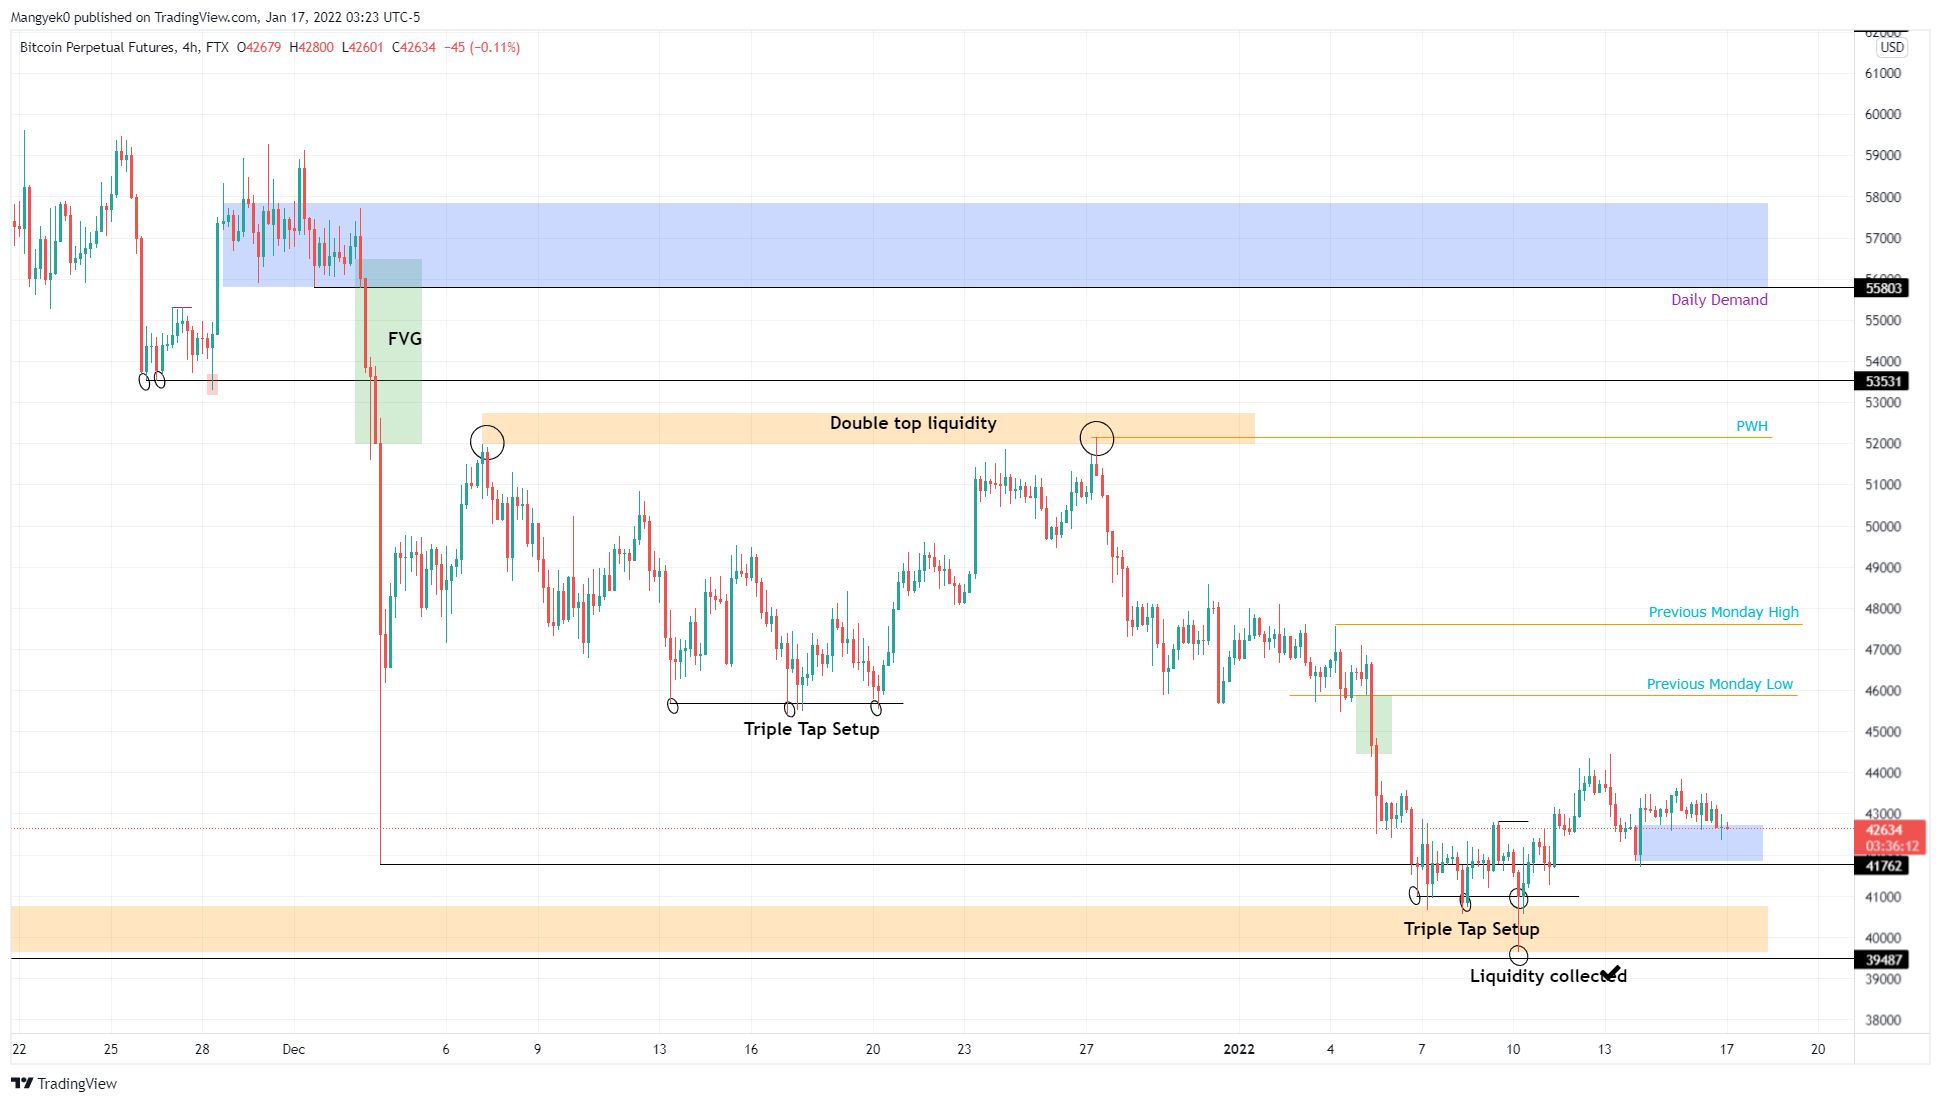
Bitcoin price produced a lower low after the January 13 swing high at $44,439 but managed to set a higher low, keeping the uptrend somewhat intact. As BTC bounces off a 4-hour demand zone, extending from $41,843 to $42,707, investors can expect the pioneer crypto to make a run for the previous week’s high at $47,609.
This hurdle is present below the 200-day Simple Moving Average (SMA) At $48,590. BTC’s upside potential, though, at least in the short-term, seems to be capped at the aforementioned level.
BTC/USD 4-hour chart
If Bitcoin price fails to see a bullish reaction off of the $41,843 to $42,707 demand zone, it will indicate weakness among buyers. This lack of interest could allow bears to take control and push BTC down to $41,762 – a four-hour candlestick close below there will then invalidate the bullish thesis.
This development could lead Bitcoin price lower, to retest the $39,87 support level.
Ethereum price shows strength
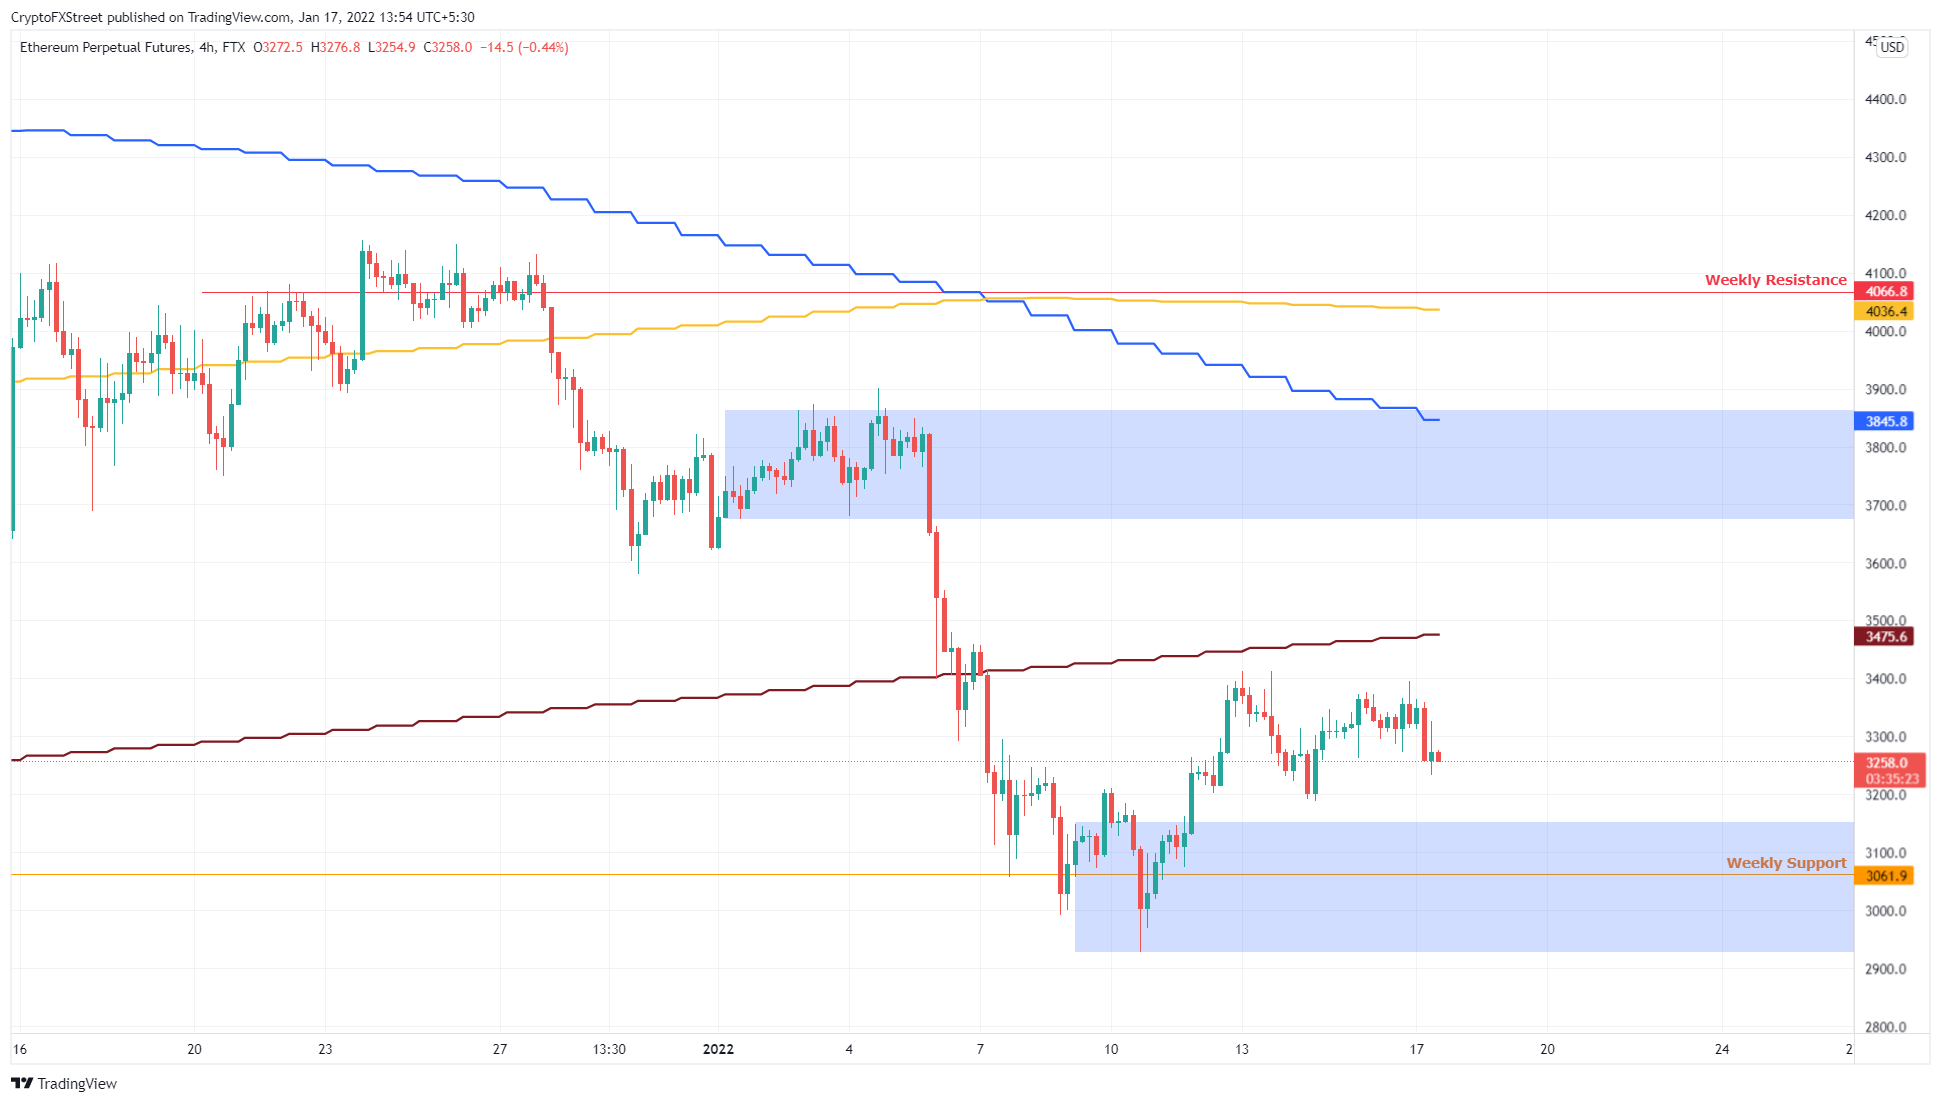
Ethereum price is in a similar situation to Bitcoin as it produced a higher low but failed to set up a higher high. As long as BTC remains bullish, ETH will follow suit. Market participants can, therefore, expect the smart contract token to make a run for the 200-day SMA at $3,475.
Clearing this hurdle will open the path for Ethereum price to revisit the daily supply zone, extending from $3,675 to $3,846. The upper limit of this hurdle coincides with the 50-day SMA, indicating that a further uptrend is unlikely.
ETH/USD 4-hour chart
Regardless of the optimistic scenario, Ethereum price needs to hold above the weekly support level at $3,061 to see a meaningful uptrend. A breakdown of this foothold will remove confidence and instill doubt among buyers.
A four-hour candlestick close below the demand zone’s lower limit at $2,927, however, will create a lower low, invalidating the bullish thesis.
Ripple price lacks motivation
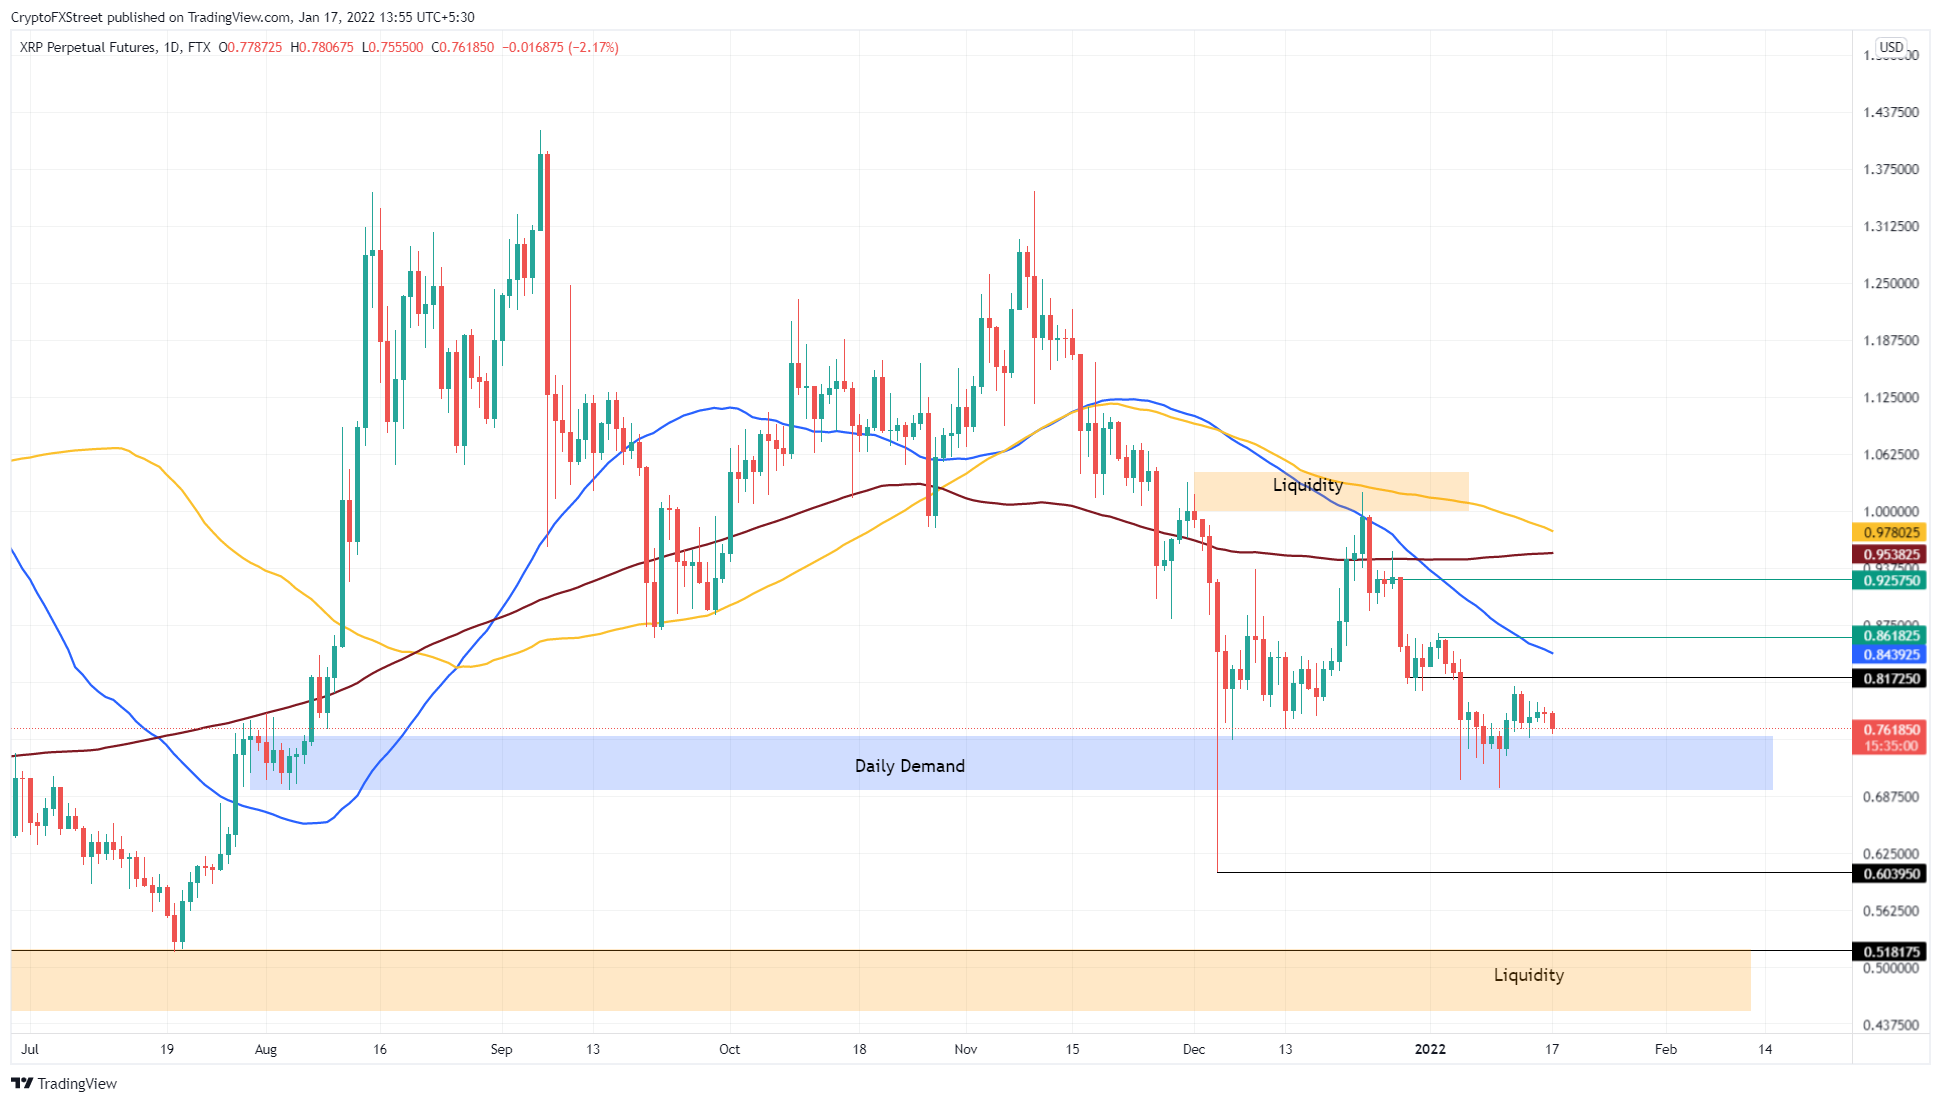
Ripple price has been teetering on a daily demand zone, stretching from $0.693 to $0.753 since the December 4, 2021 crash. One can assume that this barrier has been weakening. Due to its correlation with BTC, however, XRP price is likely to rally 12% to retest the 50-day SMA at $0.844.
The weakened demand zone could face destruction by a short-term bearish momentum, however, so investors should exercise caution with the remittance token.
In some cases, Ripple price could overcome the immediate hurdle and make a run for the 200-day SMA at $0.954.
XRP/USD 1-day chart
On the other hand, if Ripple price produces a daily candlestick close below $0.693, it will create a lower low, invalidating the bullish thesis. This development could trigger a crash, where XRP price could revisit the $0.604 support level.
Author

Akash Girimath
FXStreet
Akash Girimath is a Mechanical Engineer interested in the chaos of the financial markets. Trying to make sense of this convoluted yet fascinating space, he switched his engineering job to become a crypto reporter and analyst.


