XRP Price Prediction: Ripple at risk of 25% correction
- Ripple price sees bulls unable to hold $0.78 as pressure mounts to the downside.
- XRP price could test the green supporting trend line soon with a possible pennant break to the downside.
- With remote support at $0.70, expect a quick test towards $0.58.

Ripple (XRP) price ranges in a tight pennant with signals pointing to the downside as bulls are unable to hold the $0.78 support level, which is in the process of being transformed into resistance by bears. The low of today is just a few ticks shy of the ascending side of the pennant, and could see bears putting their foot down on the selling pedal and accelerating a move down. Expect some hesitation around $0.70, but ultimately price will want to see $0.58 as an end station for bears’ near-term short positions.
A 25% devaluation would be suitable for XRP
Although a pennant can still go either way, bulls look to be unable to hold support at $0.78 within the pennant. This is to be perceived as a bearish signal, together with the Relative Strength Index fading away from 50 and pointing to more downside risk. The low of today barely touched the ascending side of the pennant, which will put mounting pressure on bulls trying to defend that support over the short-term.
If bulls cannot hold XRP price action along that ascending side, expect to see a quick nose dive in two phases – the first, a halt around $0.70, which was the January 10 low and thus signifies a retest of the low of this year. Then, expect new lows to be penciled in for the year as bears will want to keep their gains locked in until $0.58, which would return them 25% of value. That level holds a historical significance and is also the monthly S1 support level.
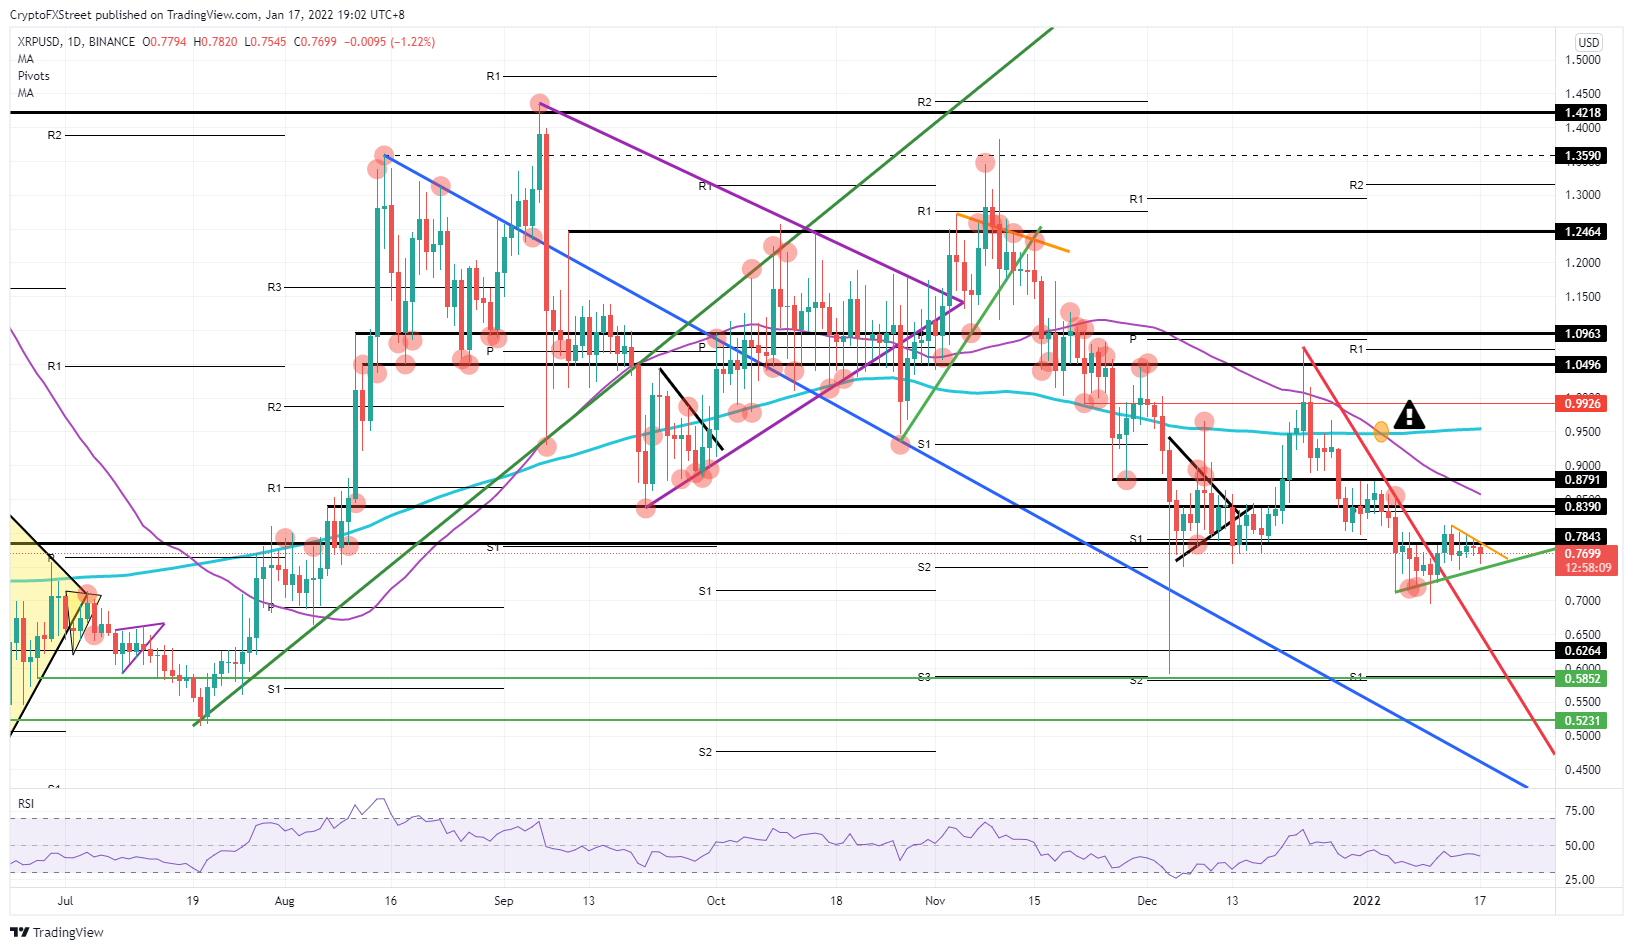
XRP/USD daily chart
A pop to the upside could still be on the cards when global markets can find it within themselves to finally shrug off the negative sentiment surrounding the FED's rate hike policy outlook to contain inflation. Expect once that happens to see a quick reversal to $0.84, with the pennant breaking to the upside and the $0.78 level holding support again. Investors will rush in to push price action back towards $0.88 – with the 55-day Simple Moving Average (SMA) getting in the way – as the Relative Strength Index (RSI) quickly trades back above 50. The point at which the the 200-day and the 55-day SMA crossed, at $0.95, however, provides a possible entry level for bears to begin a fightback.
Author

Filip Lagaart
FXStreet
Filip Lagaart is a former sales/trader with over 15 years of financial markets expertise under its belt.



