XLM Price Prediction: Stellar must hold this crucial support to avoid a steep correction targeting $0.20
- Stellar is dealing with multiple resistances at $0.3 and the ascending channel’s upper boundary.
- A recent sell signal on the hourly chart seems to be calling for more sell orders as overhead pressure rises.

Although not a substantial one, stellar has sustained recovery following the breakdown from the recent new yearly high at $0.4. Besides, the cross-border transfer token continues to trade within a descending parallel channel. Price action has been limited at $0.3, delaying recovery and allowing bearish pressure to build.
Why Stellar must hold the position above the 100 SMA
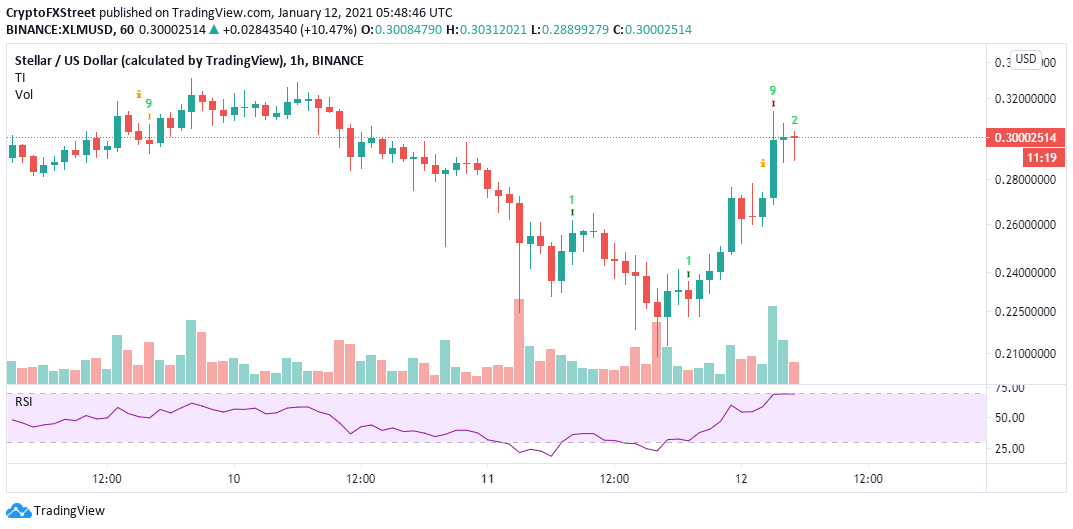
The hourly chart shows XLM dancing at $0.298 after rejection at the channel’s upper boundary in conjunction with $0.3. According to the Relative Strength Index, recovery is not easy due to the rejection at 70.
On the downside, Stellar must hold the support at the 100 Simple Moving Average on the 1-hour chart to avoid losses that are likely to retest the middle boundary of the channel. Depending on the magnitude of the overhead pressure, XLM might extend the bearish leg to $0.2.
%20(18)-637460282102294814.png)
XLM/USD 1-hour chart
The TD sequential indicator recently presented a sell signal on the hourly chart. The call to sell manifested in a green nine candlestick, suggesting that the bearish outlook might see a correction in one to four hourly candlesticks.
A red two candlestick forming below a previous red one candle could serve as validation that Stellar is poised to drop further.
XLM/USD 1-hour chart
It is worth mentioning that the 4-hour chart shows XLM trading above all the three applied moving averages, including the 50 SMA, 100 SMA, and 200 SMA. The 50 SMA has left a wide gap above the 100 SMA, hinting that buyers have the upper hand, at least in the short term.
%20(19)-637460282260745454.png)
XLM/USD 4-hour chart
Simultaneously, closing the day above the immediate resistance at $0.3 is likely to call for more buy orders as investors’ confidence in recovery improves. A break above the ascending channel may boost Stellar back to the price levels around $0.4.
Author

John Isige
FXStreet
John Isige is a seasoned cryptocurrency journalist and markets analyst committed to delivering high-quality, actionable insights tailored to traders, investors, and crypto enthusiasts. He enjoys deep dives into emerging Web3 tren


