|

XLM Price Analysis: Stellar explodes 200% and faces a potential correction

  • XLM price is up by more than 200% since January 3 as XRP loses strength.
  • It seems that XRP holders are eying up XLM as a potential investment option.

Cryptocurrency enthusiasts have always debated which coin was better, XLM or XRP. Both have a shared history and founders but there are significant differences like the ownership of coins. After the SEC sued Ripple, it seems that many XRP investors have switched their attention towards XLM as a potential alternative. 

XLM price faces short-term correction after massive rally

After a 200% rally towards $0.39, XLM seems to be slowing down and faces a potential correction. On the 2-hour chart, the TD Sequential indicator has just presented a sell signal.
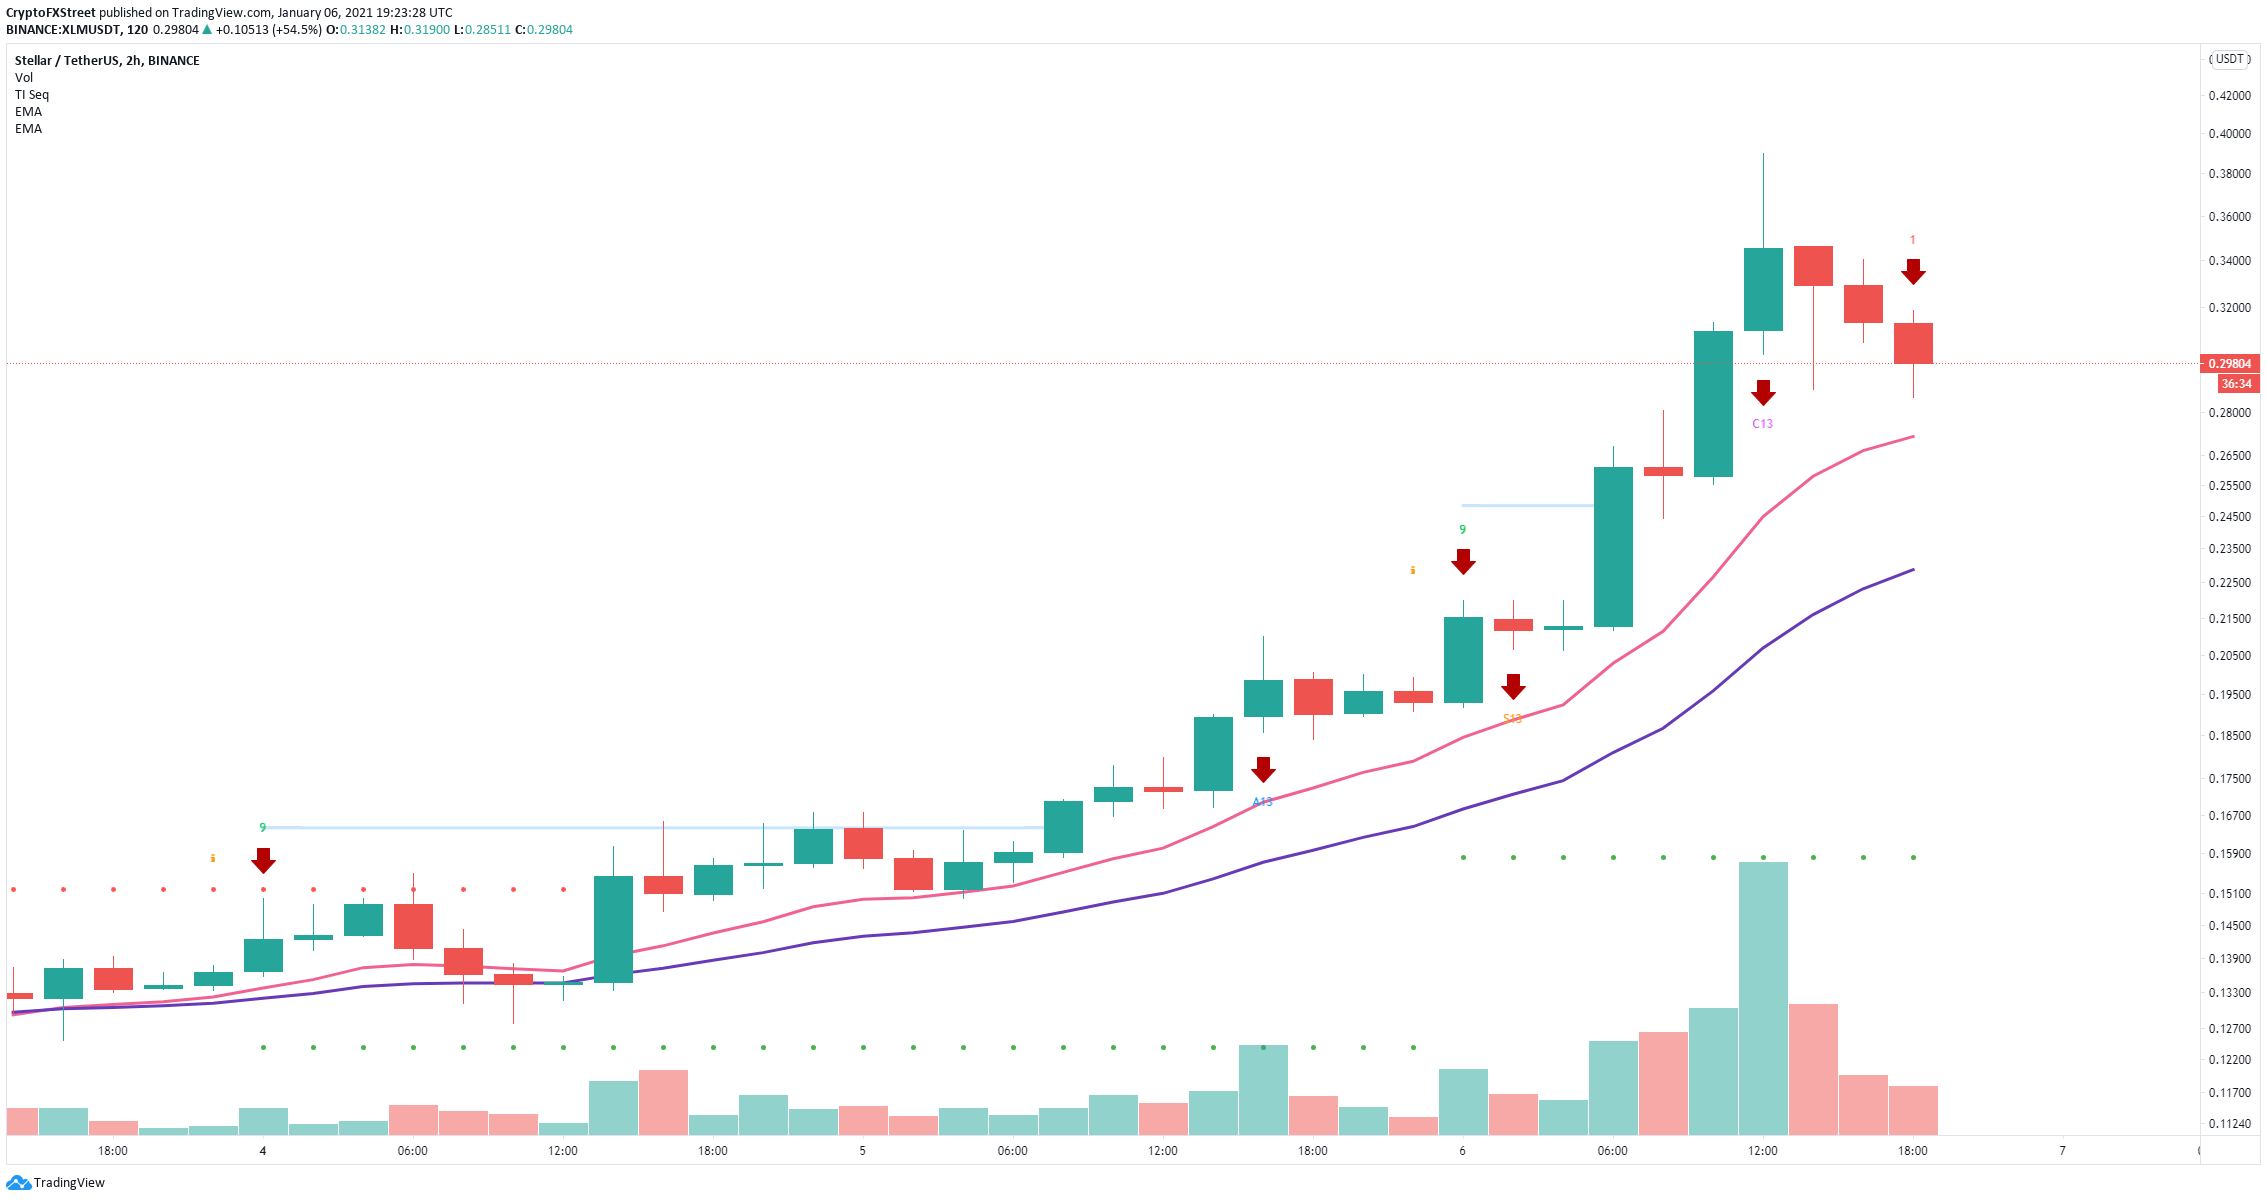
xlm price

XLM/USD 2-hour chart

The validation of this signal can quickly push XLM down to the 26-EMA at $0.231 if the 12-EMA at $0.27 is broken. Below that level XLM can find support at around $0.205 and $0.18.

However, if the bulls can defend the 12-EMA at $0.27, they will face very little support to the upside. XLM price can quickly climb back towards the high of $0.39 and above hitting the psychological level at $0.40

Author

Lorenzo Stroe

Lorenzo Stroe

Independent Analyst

Lorenzo is an experienced Technical Analyst and Content Writer who has been working in the cryptocurrency industry since 2012. He also has a passion for trading.


More from Lorenzo Stroe
Share:

Editor's Picks

Ripple tumbles as sell-side pressure intensifies

Ripple edges lower and trades at $1.45 on Wednesday, as headwinds intensify across the crypto market. Major crypto assets remain in bearish hands, with Bitcoin falling below $84,000 and Ethereum below $2,800.

Crypto Today: Bitcoin, Ethereum and XRP fall liquidating $550M

Bitcoin’s correction follows a recent rejection due to supply around $87,200. Altcoins are generally in a correction trend, as Ethereum edges lower toward the next key support at $2,600 and Ripple extends its down leg near the $1.45 demand area.

Polygon extends decline as shutdown rumors fuel panic selling

Polygon is down nearly 5% on Wednesday, amid selling pressure linked to rumors of a network shutdown sparked by a social media post. Derivatives data shows a sell-side dominance as Open Interest declines 13% over the last 24 hours while funding rates flip negative.

Pi Network Price Forecast: Steady decline risks a lower leg below $0.080

Pi Network (PI) continues to extend a bearish phase over the last seven days, risking a breakout below the $0.0800 round figure. The social chatter surrounding the PI token is on the rise, likely driven by investors’ fear.

Bitcoin: Is BTC setting up for an Uptober rally?
Bitcoin (BTC) extends its gains, trading near $86,000 at the time of writing on Friday after closing September 6.33% up, reversing its seasonal weakness. Historical data suggest October could be a strong month for BTC, especially after a positive September.