XLM Price Prediction: Stellar fails at resistance, projects deep correction
- XLM price hugging the secondary trend line of the ascending channel.
- Second bearish reversal above channel reinforcements bearish tilt.
- Bearish momentum divergence persists on multiple time frames, increasing downward pressure.

XLM price action since the bearish shooting star candle pattern on May 10 has been a mix of indecision and failed attempts to ascend the channel’s upper trend line. As long as Stellar does not close above the shooting star high on a daily basis, the bearish outlook takes precedent, targeting a 40% decline.
XLM price stalemate disguises a gradual deterioration in Stellar
Stellar rallied strongly in the early part of 2021. Still, XLM price has only managed to print marginal new highs in April and again in May, delivering a disappointing 30% return for Stellar from the February high to the May high.
On May 10, XLM price closed with a bearish shooting star candlestick on the daily chart. The finale of a powerful rally from the April low into the May 10 high at $0.780 provided a 100% gain for the timely investors. The candlestick reversal pattern is framed when buyers struggle to lift prices higher against the considerable distribution pressures of the sellers’.
On May 12, XLM price fell below the shooting star low at $0.618, confirming the bearish candlestick and a bearish thesis for the digital token. However, Stellar struck some buying pressure and briefly traded above the shooting star on May 16. Still, the rally quickly faded and shaped a second, loosely defined shooting star above the channel’s upper trend line.
The marginal new high printed by Stellar has now established a potential double top pattern with a trigger at $0.552. To successfully activate the pattern, XLM price will need to fall below the secondary trend line that has provided continuous support since the April low. A daily close below the trend line increases the odds that Stellar will extend the decline below the double bottom and target the channel’s lower trend line at $0.411, representing a 38% decline from price at the time of writing.
On the path to the channel’s lower trend line, XLM price will encounter support at the 50-day simple moving average (SMA) at $0.546, followed closely by the 61.8% Fibonacci retracement of the April-May advance at $0.538. Some support may materialize at the 78.6% retracement at $0.473, but it is anticipated the channel’s lower trend line at $0.411 will generate a form of capitulation.
Adding to the negative outlook is the bearish momentum divergence on the Stellar daily and weekly Relative Strength Indexes (RSI). It occurs when the RSI fails to print a new high with price, revealing a decline in price momentum.
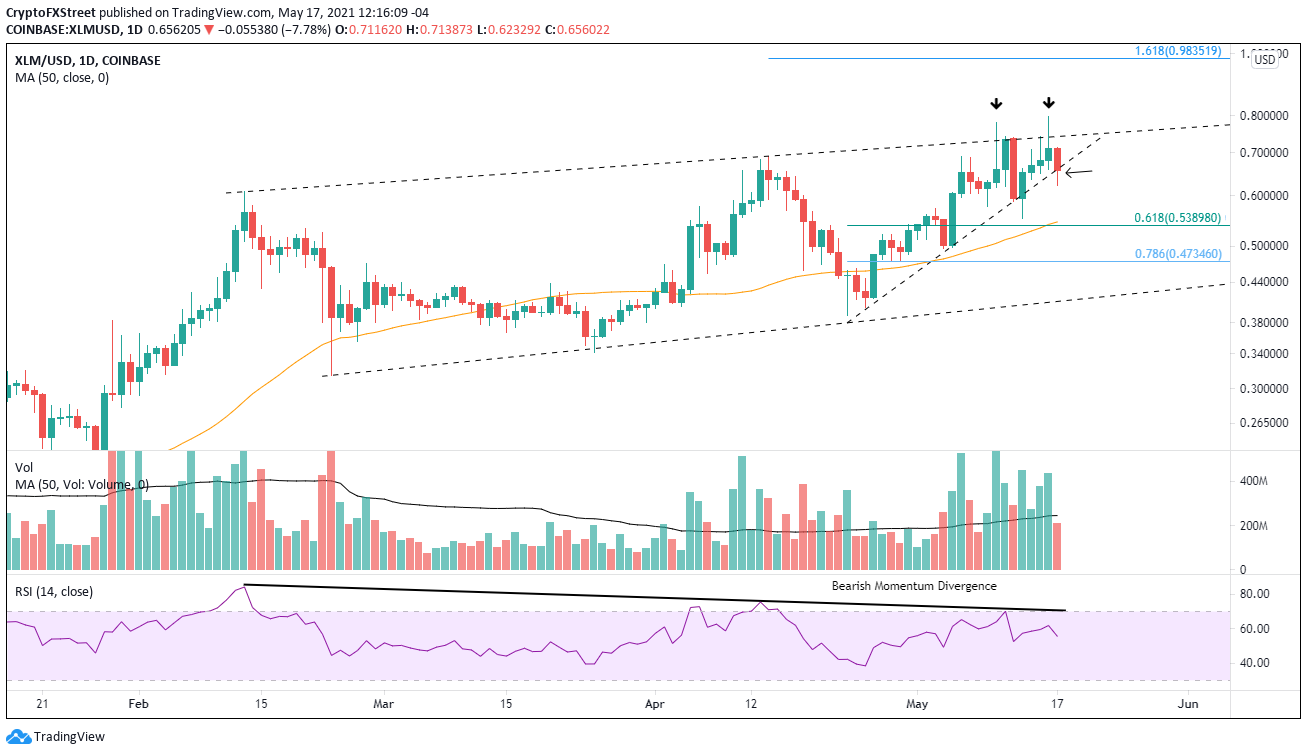
XLM/USD daily chart
A daily close above the second shooting star at $0.797 will invalidate the Stellar bearish outlook, and the channel’s upper trend line switches from resistance to support. Under this scenario, investors could see a rally to the junction of the 161.8% extension of the April decline at $0.983 and the psychologically important $1.00.
Author

Sheldon McIntyre, CMT
Independent Analyst
Sheldon has 24 years of investment experience holding various positions in companies based in the United States and Chile. His core competencies include BRIC and G-10 equity markets, swing and position trading and technical analysis.


