XLM Price Forecast: Stellar in disarray, exposed to a 15% decline
- XLM price logging the worst day since June 25, altcoin on track to test the June 22 low of $0.198.
- Stellar daily Relative Strength Index (RSI) is nearing the first oversold reading since June 21.
- A reversion to the 200-week simple moving average (SMA) is the final support before catastrophic outcomes.

XLM price has only recorded three positive weeks over the last nine weeks, with the best weekly gain being 3.19%. After the sustained period of weakness, Stellar now resides just 15% above the 200-week SMA; an indicator last visited in early January. As a result, the downward trajectory remains firm, and the digital asset should test at least the June 22 low of $0.198 moving forward.
XLM price has yet to compel the whales out from the depths
XLM price traded in a descending parallel channel from the June 29 high of $0.293, triggering the second symmetrical triangle in a month. On July 16 and 18, Stellar attempted to release from the channel but was emphatically rejected both times, culminating in today’s -7% decline and renewing the rush to test at least the June 22 low of $0.198.
Standing in front of a test of the June 22 low is the lower range of the descending parallel channel at $0.205, but it should prove to be a minor challenge with the magnet effect of $0.198 pulling on XLM price. A drop to the June 22 low would be just a 7% loss from the current Stellar price.
If selling pressure continues or accelerates in the cryptocurrency complex, XLM price will strike support at the 78.6% Fibonacci retracement of the advance beginning in March 2020 at $0.191. However, under the weight of a heavy market, Stellar could easily test the 200-week sma at $0.182, yielding a 15% fall from the current price and pushing the cryptocurrency into an extreme oversold condition where a sustainable, multi-week rally can potentially commence.
Any weakness below the 200-week SMA will lead to catastrophic outcomes for XLM price.
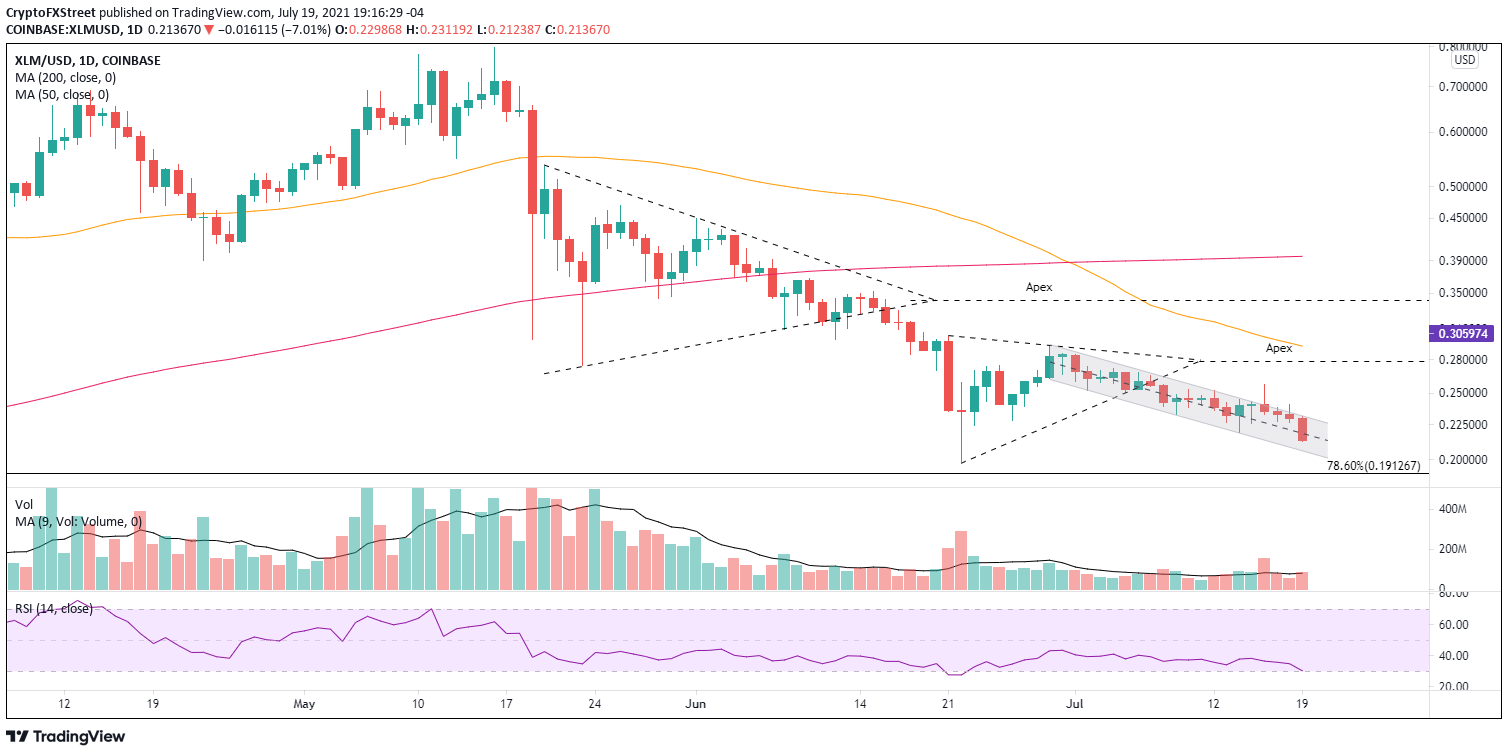
XLM/USD daily chart
An opportunity to the long side becomes more discernible if XLM price records a daily close above the July 18 high of $0.240. Identifiable resistance emerges at the apex of the broken symmetrical triangle in July at $0.278, followed closely by the 50-day SMA at $0.292, representing a 20% gain from the July 18 high.
A robust cryptocurrency market could extend the rally to the apex of the first broken symmetrical triangle in June at $0.341, and if everything aligns for Stellar, a test of the 200-day SMA at $0.386.
XLM price is nearing an inflection point where another -7% decline could mark the end of the significant correction from the May high. Still, the current price structure remains vulnerable to deeper losses as the whales are not surfacing to capitalize on the low prices, putting Stellar in a position of disarray.
Author

Sheldon McIntyre, CMT
Independent Analyst
Sheldon has 24 years of investment experience holding various positions in companies based in the United States and Chile. His core competencies include BRIC and G-10 equity markets, swing and position trading and technical analysis.


