Stellar Lumens Price Prediction: XLM on the verge of massive 50% freefall to $0.08
- Stellar’s uptrend recently hit a barrier at $0.18, while the downside is immediately protected at $0.17.
- A sell signal by the TD Sequential indicator on the daily chart hints at a massive correction to $0.08.

Stellar is holding in consolidation, just like other cryptocurrencies in the market. The weekend session was lethargic in price action, apart from the rebound from $0.16 to $0.18.
XLM is stuck between the key resistance at $0.18 and the immediate support at $0.17. A massive freefall to $0.1 is likely to come into the picture if Stellar closes the day under the initial support.
Stellar’s potential breakdown reinforced by a sell signal
XLM/USD is trading at $0.173 at the time of writing. The 100 Simple Moving Average emphasizes the support at $0.17 on the 4-hour chart. Massive losses will befall the cross-border token if the price dives under this critical moving average by the end of the day. The next tentative support areas include the 200 SMA and $0.1.
%20(11)-637429238076244491.png)
XLM/USD 4-hour chart
The TD Sequential indicator has flashed a sell signal on the weekly chart, encouraging sellers to increase their positions. The call to sell manifested in a green nine candlestick and, if validated, may result in significant losses. According to the weekly chart, the most potential support area is $0.12, but declines could stretch to the 50 SMA and 100 SMA.
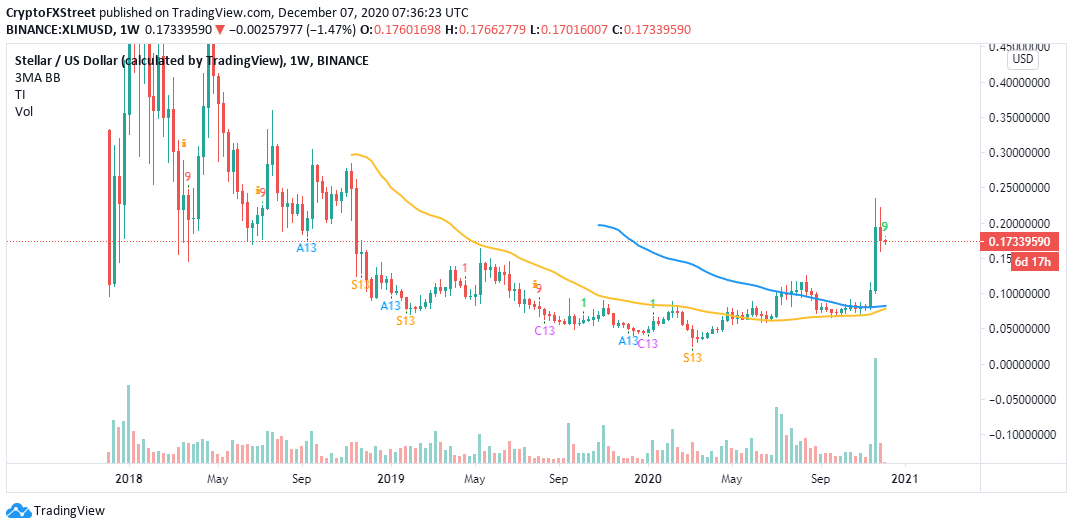
XLM/USD weekly chart
On the upside, it is worth mentioning that the bearish outlook will be abandoned if Stellar recovers past $0.18 and perhaps closes the day above the 50 SMA. Buyers on the sidelines would be encouraged to join the market in anticipation of gains above $0.2. If enough volume is created, the tailwind behind Stellar will swell for a price action eyeing $0.23 (November high).
Author

John Isige
FXStreet
John Isige is a seasoned cryptocurrency journalist and markets analyst committed to delivering high-quality, actionable insights tailored to traders, investors, and crypto enthusiasts. He enjoys deep dives into emerging Web3 tren



