- XLM price tapped the lower trend line of an ascending parallel channel during the recent crash.
- A continuation of the bounce from this level shows the promise of a 200% bull rally to $1.42, a new all-time high.
- Stellar could start a new downtrend if the lower range of the demand zone at $0.40 is shattered.
XLM price rally and the latest crash seem to be respecting a technical pattern that has contained it for nearly five months. Now, a retest of the lower boundary could signal the start of a new upswing.
XLM price eyes new highs
XLM price action since late November 2020 has been contained in an ascending parallel channel. This setup is formed when Stellar’s higher highs and higher lows are connected using trend lines.
The recent market crash caused XLM to shed 27% of its market value. However, the crash found support at the lower trend line of the channel and shows healthy buying activity, which suggests a continuation of this upward trajectory.
The last two times Stellar tapped the channel’s lower boundary, a humungous bull run followed. Hence, if something similar were to happen, XLM price can head toward the 127.2% Fibonacci extension level at $1.42, a new all-time high.
However, investors should wait for a retest of the 50 Simple Moving Average (SMA) on the 1-day chart. During the uptrend, the buyers will face stiff resistance around the supply zone that ranges from $0.58 to $0.69. Hence, clearing these levels will provide a secondary confirmation for the bullish outlook.
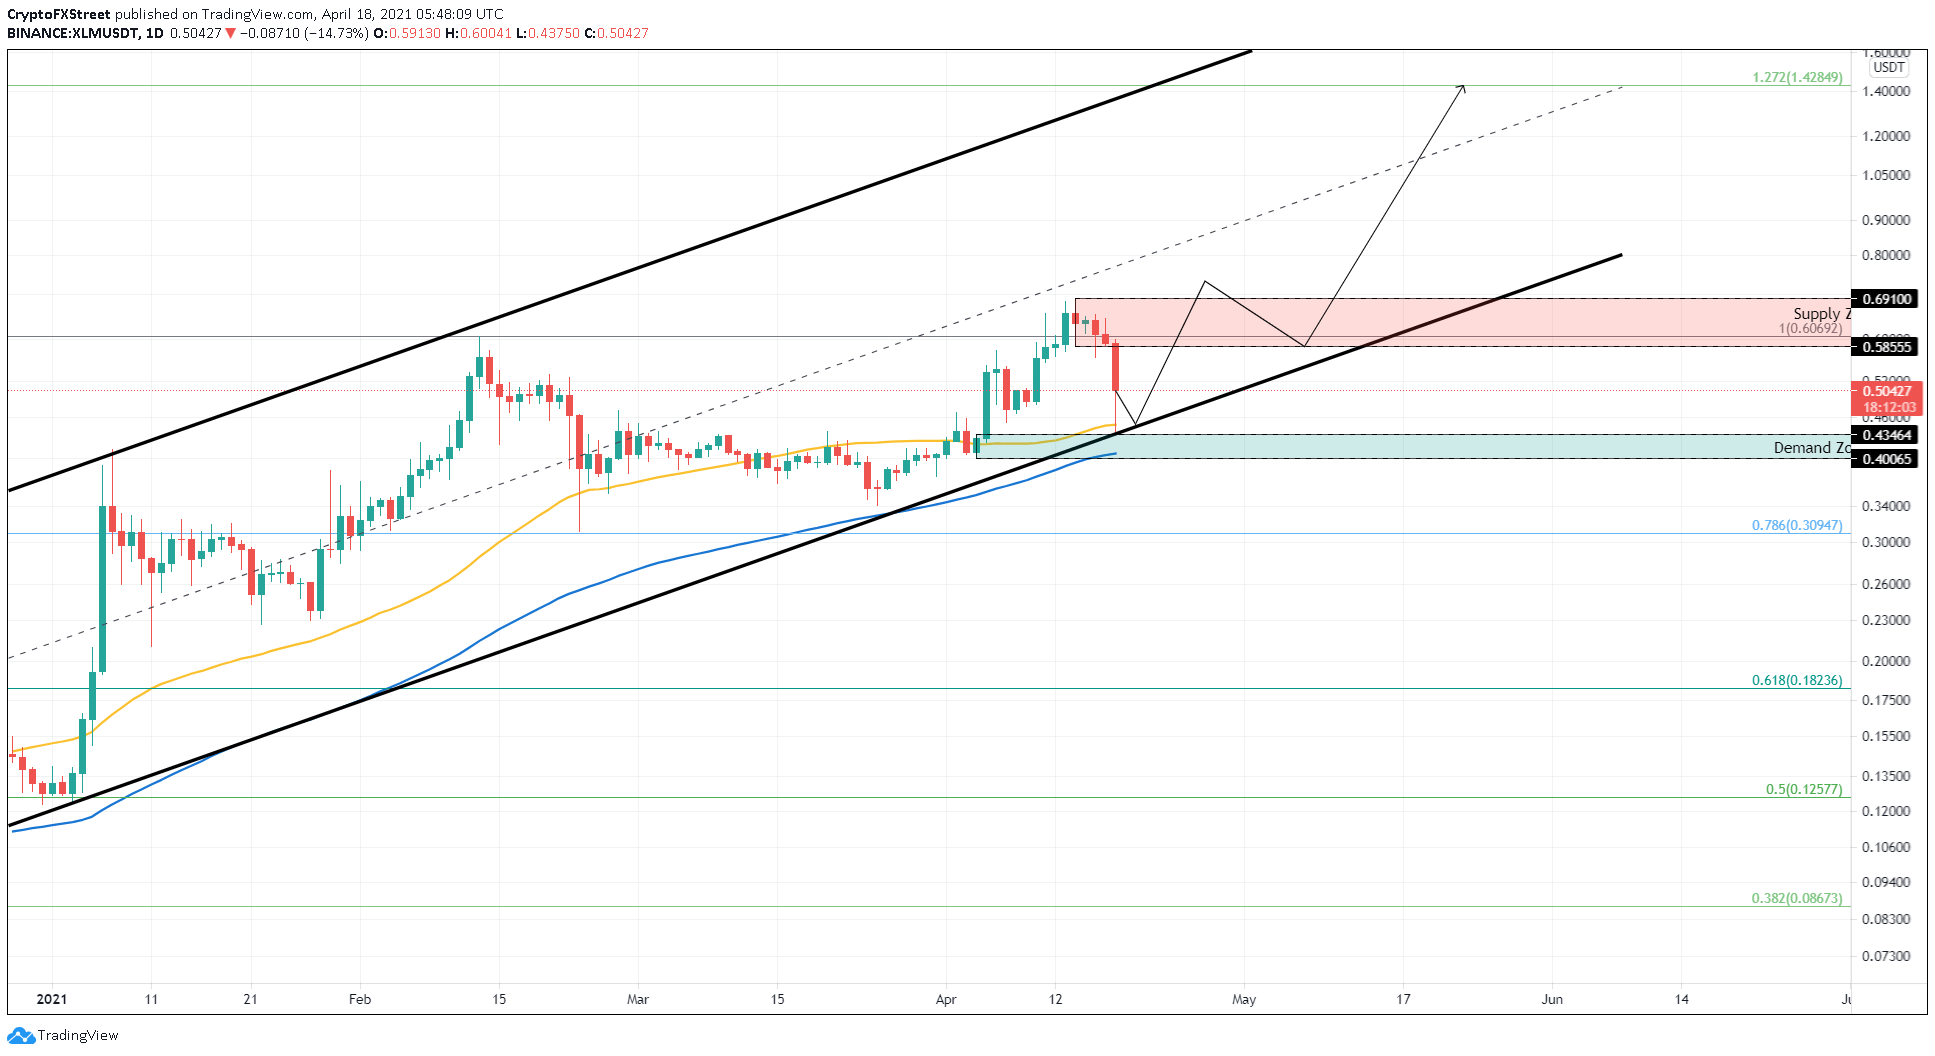
XLM/USDT 1-day chart
Regardless of the accumulation, if sellers overwhelm the buying pressure leading to a decisive close below the lower boundary of the demand zone at $0.40, it would invalidate the bullish outlook.
If XLM price trades below this zone for an extended period, a 13% correction to $0.34 seems likely.
Information on these pages contains forward-looking statements that involve risks and uncertainties. Markets and instruments profiled on this page are for informational purposes only and should not in any way come across as a recommendation to buy or sell in these assets. You should do your own thorough research before making any investment decisions. FXStreet does not in any way guarantee that this information is free from mistakes, errors, or material misstatements. It also does not guarantee that this information is of a timely nature. Investing in Open Markets involves a great deal of risk, including the loss of all or a portion of your investment, as well as emotional distress. All risks, losses and costs associated with investing, including total loss of principal, are your responsibility. The views and opinions expressed in this article are those of the authors and do not necessarily reflect the official policy or position of FXStreet nor its advertisers. The author will not be held responsible for information that is found at the end of links posted on this page.
If not otherwise explicitly mentioned in the body of the article, at the time of writing, the author has no position in any stock mentioned in this article and no business relationship with any company mentioned. The author has not received compensation for writing this article, other than from FXStreet.
FXStreet and the author do not provide personalized recommendations. The author makes no representations as to the accuracy, completeness, or suitability of this information. FXStreet and the author will not be liable for any errors, omissions or any losses, injuries or damages arising from this information and its display or use. Errors and omissions excepted.
The author and FXStreet are not registered investment advisors and nothing in this article is intended to be investment advice.
Recommended Content
Editors’ Picks
Shiba Inu could recover as it finds support around key level
Shiba Inu (SHIB) price hovers around $0.000021 on Tuesday after retesting and bouncing off from key support the previous day. Sideline investors looking to accumulate SHIB can do so at support levels from $0.000019 to $0.000021.
Bitcoin recovers after retesting $90K support
Bitcoin’s price recovers and trades at around $95,500 on Tuesday after dipping below $90,000 the previous day. The recent downturn at the start of the week has liquidated over $734 million in total liquidations, more than $152 million specifically in BTC.
Monero bulls remain strong, eyes double-digit gains
Monero price trades in the green, around $204.92 on Tuesday after holding its ascending trendline support the previous day. The technical outlook suggests a reversal ahead as XMR’s MACD indicator shows a bullish signal.
XRP sees high buying pressure as lawyer weighs in on SEC's appeal against Ripple
XRP's strong resilience against the wider crypto market decline was strengthened by increased buying activity across retail and institutional investors. SEC's delay in filing opening brief in appeal over Ripple vs SEC ruling is a normal occurrence in litigation processes.
Bitcoin: Room for a recovery or continuation of the pullback?
Bitcoin’s price slightly recovers and trades around $94,700 on Friday after declining nearly 6% earlier this week. US Bitcoin spot Exchange Traded Funds data shows signs of mild recovery, with a total net inflow of $462.2 million until Thursday.
Best Forex Brokers with Low Spreads
VERIFIED Low spreads are crucial for reducing trading costs. Explore top Forex brokers offering competitive spreads and high leverage. Compare options for EUR/USD, GBP/USD, USD/JPY, and Gold.