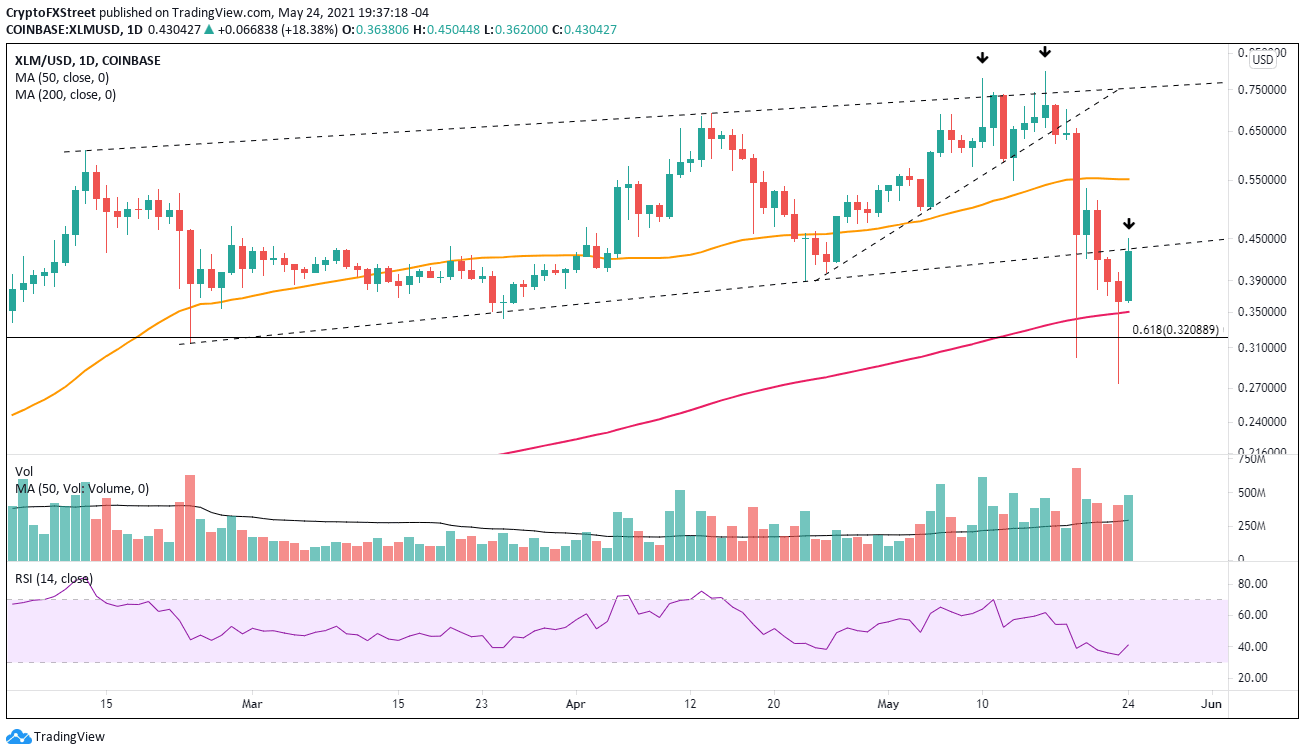
• XLM price triggers a bullish daily hammer candlestick pattern with a trade above $0.401.
  • 12-hour Relative Strength Index (RSI) prints an oversold reading similar to the February low.
  • Ascending channel’s lower trend line shifts from support to resistance.

XLM price could not escape yesterday’s selling pressure and collapsed below the May 19 crash low before rebounding back above the strategically important 200-day simple moving average (SMA). Based on prices from Coinbase, it was the largest weekly decline since August 2014 at -48.90%. The channel’s lower trend line and the 200-day SMA likely to keep Stellar range bound for the foreseeable future.

XLM price retracement clears the weak holders and pockets of anxiety

The 65% decline for XLM price at yesterday’s low should not have come as a surprise for Stellar investors and readers of FXStreet. The digital token was entangled in a precarious situation highlighted by two daily shooting star patterns at the channel’s upper trend line and a bearish momentum divergence on the daily and weekly RSI at the April and May highs.  

On May 19, XLM price sliced through the 50-day SMA, the channel’s lower trend line and the 200-day SMA, removing the weakest of holders and biggest pockets of anxiety. The result was a 50% rebound and a close above the channel’s lower trend line.

The moment of relief proved short-lived as XLM price plummeted below the May 19 low yesterday, evacuating the investors that bought the dip and effectively preparing Stellar to begin defining an actionable bottom.

Today, XLM price has tagged the channel’s vital lower trend line but has since reversed. A daily close above the trend line would alter the near-term outlook for Stellar, but not enough to position the token as a future leader for the next rally higher in the cryptocurrency complex.

Continued strength for XLM price will be confronted by the 50-day SMA at $0.551. Any further upside would need to be evaluated if Stellar does reach the tactically important moving average.

XLM/USD daily chart

XLM/USD daily chart

On the downside, XLM price is supported by the 200-day SMA at $0.350 and then the 61.8% Fibonacci extension of the rally beginning March 2020 at $0.320. Another meltdown in cryptocurrencies may drive Stellar down to yesterday’s low at $0.274.


Note: All information on this page is subject to change. The use of this website constitutes acceptance of our user agreement. Please read our privacy policy and legal disclaimer. Opinions expressed at FXstreet.com are those of the individual authors and do not necessarily represent the opinion of FXstreet.com or its management. Risk Disclosure: Trading foreign exchange on margin carries a high level of risk, and may not be suitable for all investors. The high degree of leverage can work against you as well as for you. Before deciding to invest in foreign exchange you should carefully consider your investment objectives, level of experience, and risk appetite. The possibility exists that you could sustain a loss of some or all of your initial investment and therefore you should not invest money that you cannot afford to lose. You should be aware of all the risks associated with foreign exchange trading, and seek advice from an independent financial advisor if you have any doubts.

Recommended content


Recommended Content

Editors’ Picks

Ethereum attempts recovery following first rate cut in four years

Ethereum attempts recovery following first rate cut in four years

Ethereum is trading above $2,330 on Wednesday as the market is recovering following the Federal Reserve's decision to cut interest rates by 50 basis points. Meanwhile, Ethereum exchange-traded funds recorded $15.1 million in outflows.

More Ethereum News
Bitcoin offers diversity for traditional investors: BlackRock

Bitcoin offers diversity for traditional investors: BlackRock

Bitcoin (BTC) is trading above $60,000 on Wednesday following the release of BlackRock's latest white paper, which addresses some of the top crypto assets' unique advantages to investors compared to traditional asset classes.

More Bitcoin News
XRP pulls back 4% even as Ripple releases details of stablecoin RLUSD

XRP pulls back 4% even as Ripple releases details of stablecoin RLUSD

Ripple (XRP) shared details of its stablecoin project Ripple USD (RUSD) in a blog published on Tuesday. The cross-border payment remittance firm discusses relevant legislation and plans to support the digital asset economy through RLUSD. 

More Ripple News
Bitcoin traders keep powder dry ahead of Fed decision on interest rates

Bitcoin traders keep powder dry ahead of Fed decision on interest rates

Bitcoin retraces slightly, trading above $59,000 on Wednesday, as crypto markets brace for the upcoming interest-rate decision by the US Federal Reserve, which is expected to lower interest rates for the first time in more than four years.

More Bitcoin News
Bitcoin: On the road to $60,000

Bitcoin: On the road to $60,000

Bitcoin price retested and bounced off from the daily support level of $56,000 this week. US spot Bitcoin ETFs posted $140.7 million in inflows until Thursday and on-chain data supports a bullish outlook.

Read full analysis
Moneta Markets review 2024: All you need to know

Moneta Markets review 2024: All you need to know

VERIFIED In this review, the FXStreet team provides an independent and thorough analysis based on direct testing and real experiences with Moneta Markets – an excellent broker for novice to intermediate forex traders who want to broaden their knowledge base.

Read More

BTC

ETH

XRP