Worldcoin price edges closer to a 30% rally ahead of Apple’s WWDC
- Worldcoin price shows bullish signs on both the daily and four-hour timeframes.
- The daily chart forecasts a move to $8.85, but the four-hour, short-term target suggests a revisit of $6.39.
- A breakdown of the $4.59 support level will invalidate the bullish thesis for WLD.

Worldcoin (WLD), a digital identification platform token, seems to be coiling up on the lower and higher timeframes, suggesting that a volatile breakout could be around the corner. WLD, developed by OpenAI’s Sam Altman, has been swayed by Artificial Intelligence (AI) developments in the past, be it OpenAI’s release of new frontier models or Nvidia’s earnings. Hence, Apple’s upcoming Worldwide Developers Conference (WWDC) 2024 could provide a significant tailwind to the altcoin, propelling it higher.
Also read: Worldcoin price could rally 20% if Nvidia earnings beat estimates
Worldcoin price top-down analysis
On the daily timeframe, Worldcoin price is in the process of setting up a double bottom. This pattern contains two distinctive V-shaped reversal zones. The first bottom was formed on April 14, and the second on May 27. The double-bottom trading setup will be complete after WLD manages to overcome $6.39 and flip it into a stable support level. This move would confirm a breakout from the setup and forecast a 35% upswing to $8.84.
The target is obtained by measuring the depth of the first swing low and adding it to the breakout point. In this case, the first bottom’s depth measured 35%, and the breakout point is assumed to be around $6.39.
If the flip of $6.39 occurs with the Relative Strength Index (RSI) pushing above the mean level of 50 or retesting it from a place of strength coupled with the Awesome Oscillator’s (AO) move above its mean level of 0, it would signal a massive spike in bullish momentum. This scenario would most likely kickstart a volatile move for Worldcoin price.
While the theoretical target of $8.84 might seem dramatic, WLD could see a premature slowdown around $7.82, which is the midpoint of the 65% crash that led to the formation of the first bottom.
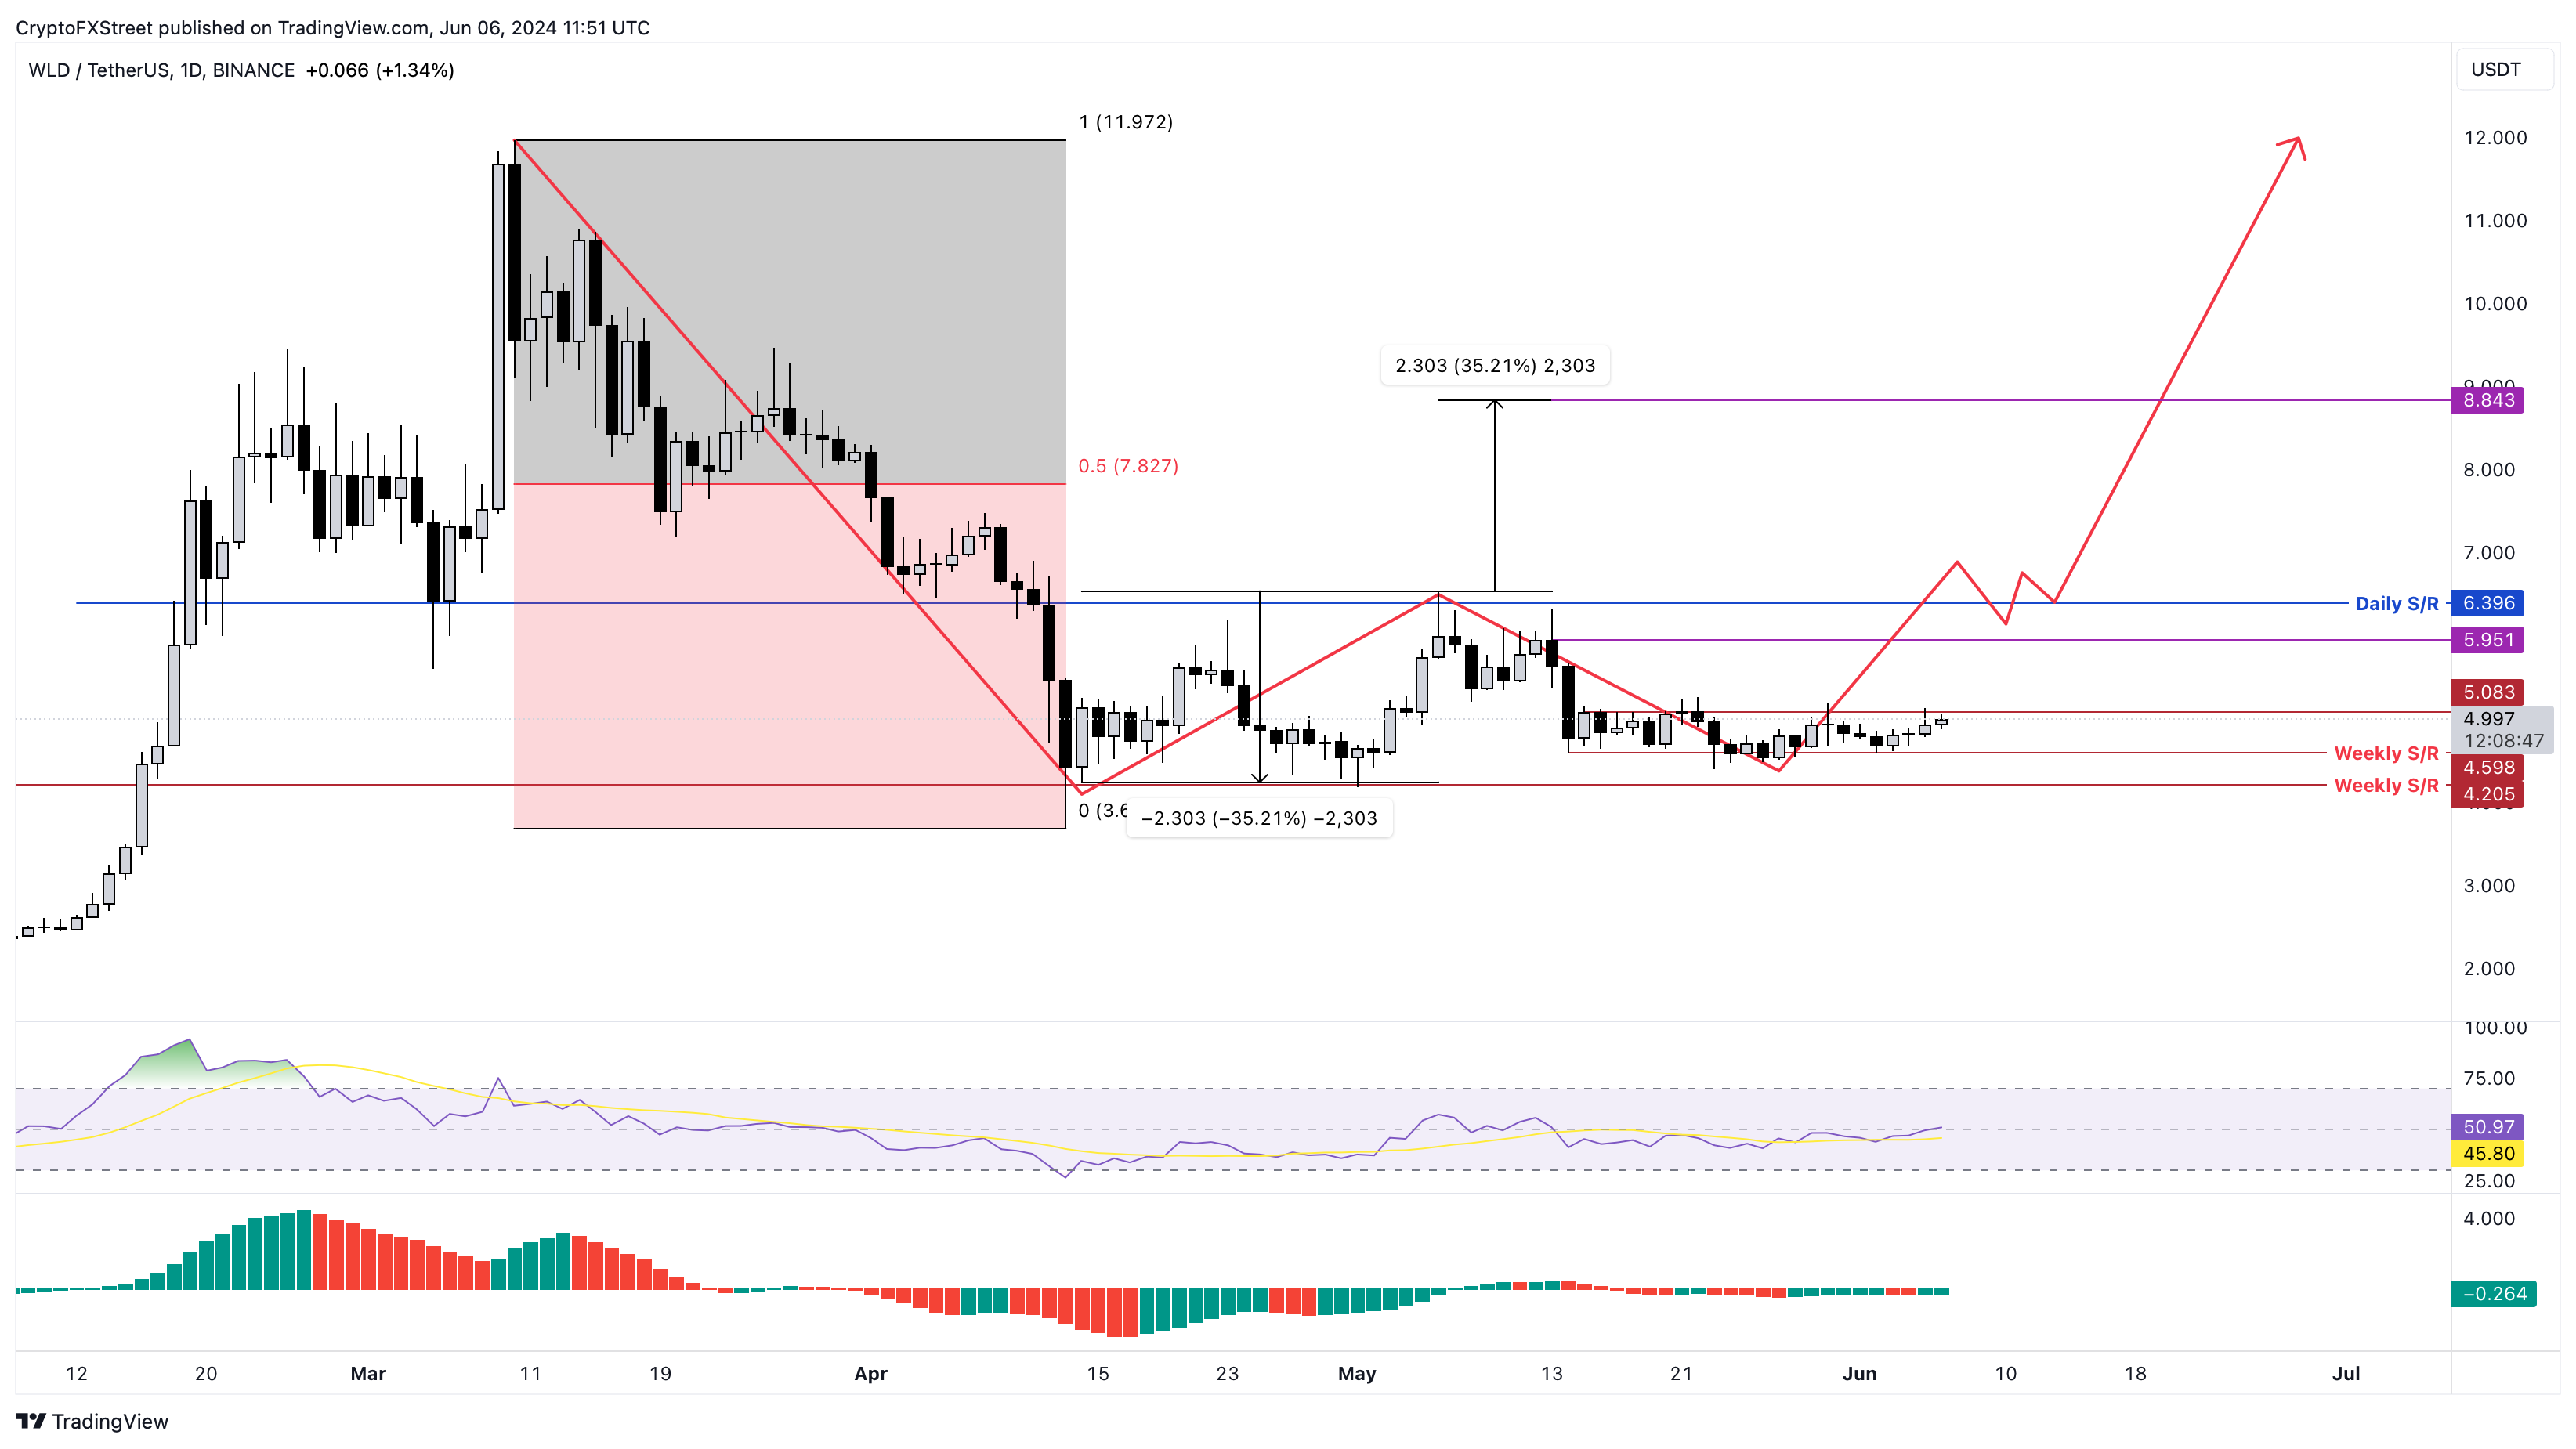
WLD/USDT 1-day chart
On the 4-hour chart, Worldcoin price has also formed a triple tap setup, which typically contains three swing lows with the central swing point lower than the other two. The swing lows on either side are at more or less the same level. This technical pattern is a variation of the triple bottom setup and signals a reversal of the downtrend.
In WLD’s case, the breakout above $5.08 could kickstart a 16% move to $5.95, the first area of interest. Beyond this level, the digital identification platform token could attempt a retest of the daily resistance level at $6.39. This move would constitute nearly a 30% gain from the current position of $5.00.
The momentum indicators are both signaling a strong presence of bullish momentum, supporting this outlook.
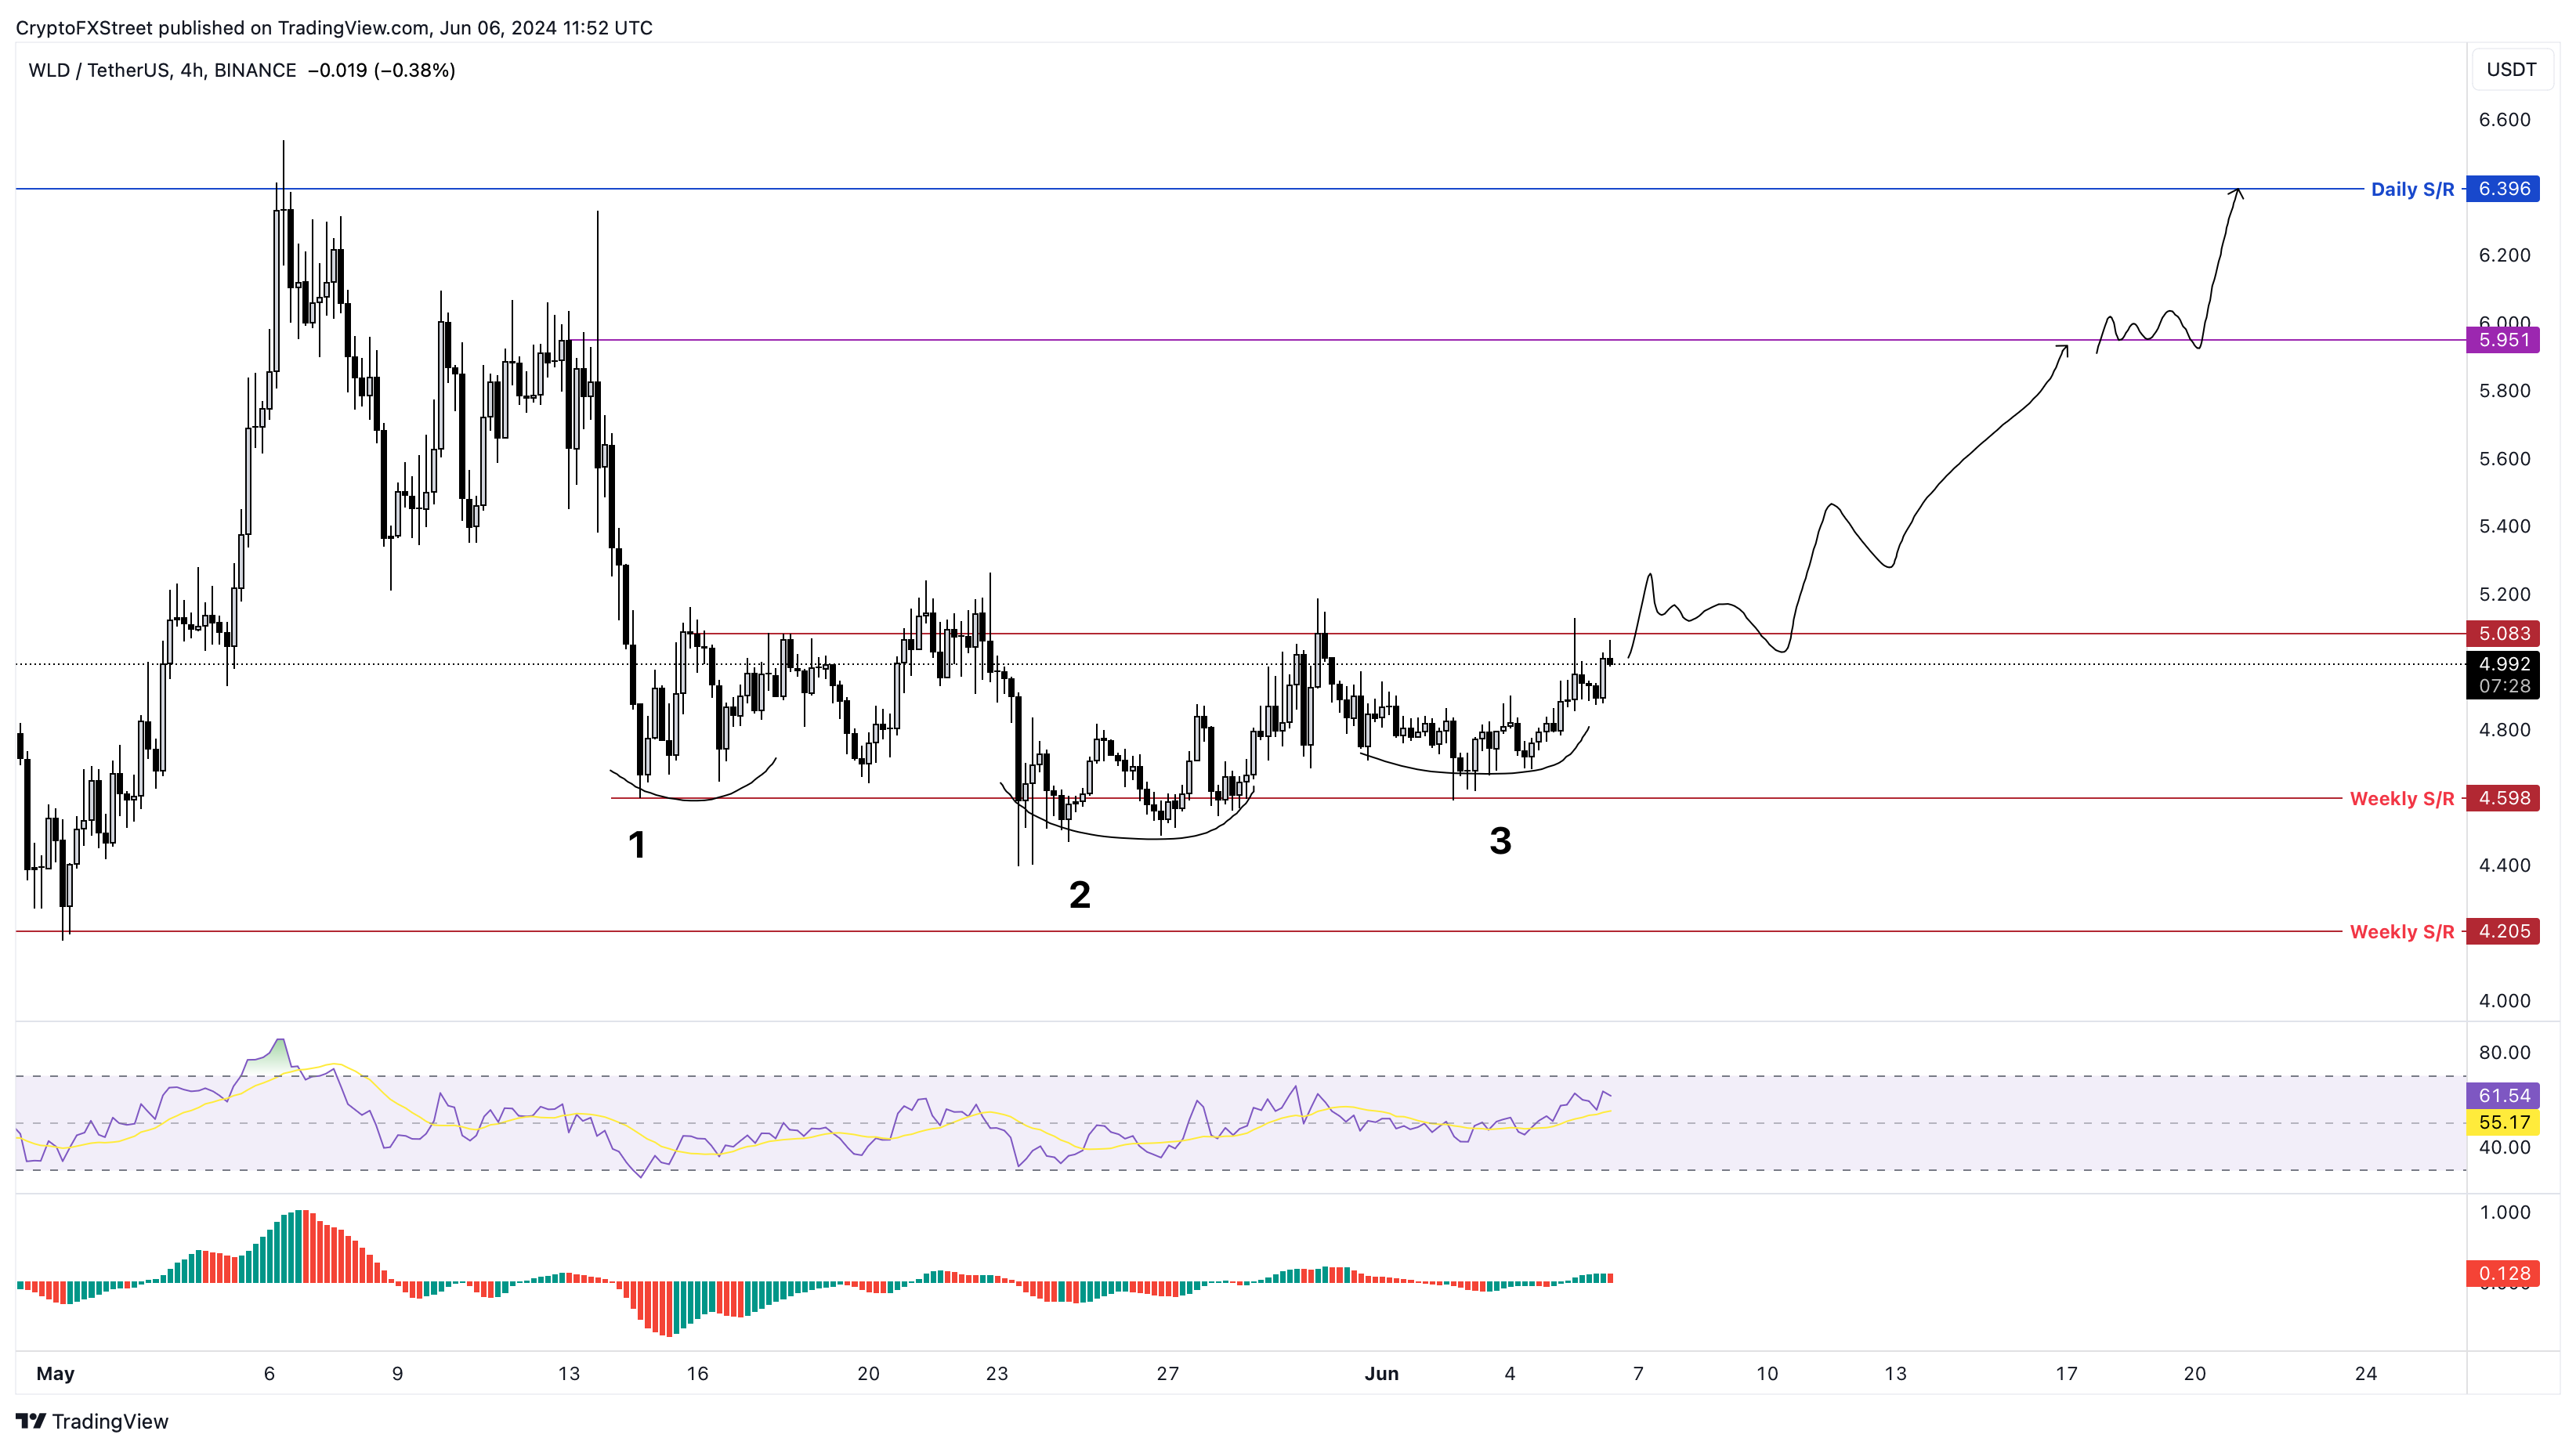
WLD/USDT 4-hour chart
On the other hand, if Worldcoin price breaks below the $4.59 support level, it will invalidate the bullish thesis for WLD by producing a lower low. Such a development could see WLD further collapse by nearly 9% to revisit the $4.20 support floor.
Author

Akash Girimath
FXStreet
Akash Girimath is a Mechanical Engineer interested in the chaos of the financial markets. Trying to make sense of this convoluted yet fascinating space, he switched his engineering job to become a crypto reporter and analyst.



