This is the signal traders need to wait for before trading Chainlink price
- Chainlink price is on a small path to a recovery.
- LINK price global sentiment still looks bearish, but the pressure is mounting.
- Depending on the breakout, await confirmation before choosing sides as a trader.
-637336005550289133.jpg)
Chainlink (LINK) price is currently stuck in two technical plays with two possible outcomes to the downside and one possible outcome to the upside. Depending on how the price action in LINK evolves, traders should refrain from trying to preposition in a trade. Instead, wait for the cue and breakout either way and join the trend rather than trying to front-run any move and getting stopped out in the end.
LINK in between three technical plays
Chainlink price is caught in three technical plays, which we will discuss in this article. The first play is the bearish triangle with the red descending trend line as the sloping side and the black supportive pivotal level at $5.27 as the triangle's base. Expect price action to bounce off both technical lines before finally breaking below the black horizontal line and making new lows below $5.27 towards $4.50 at the monthly S1 supportive level.
LINK price could also be in a pennant with a bearish outcome as the red and green trend lines are nearing their consolidation. With price action nicely respecting both trend lines, expect buyers and sellers to get squeezed towards each other with lower highs and higher lows. At one point, a breakout will unfold, and on the break of the green ascending trend line, bears will jump in, running price action further down towards $5.27 and possibly even seeing it overshoot towards $4.50 in a similar descent to the bearish triangle mentioned before.
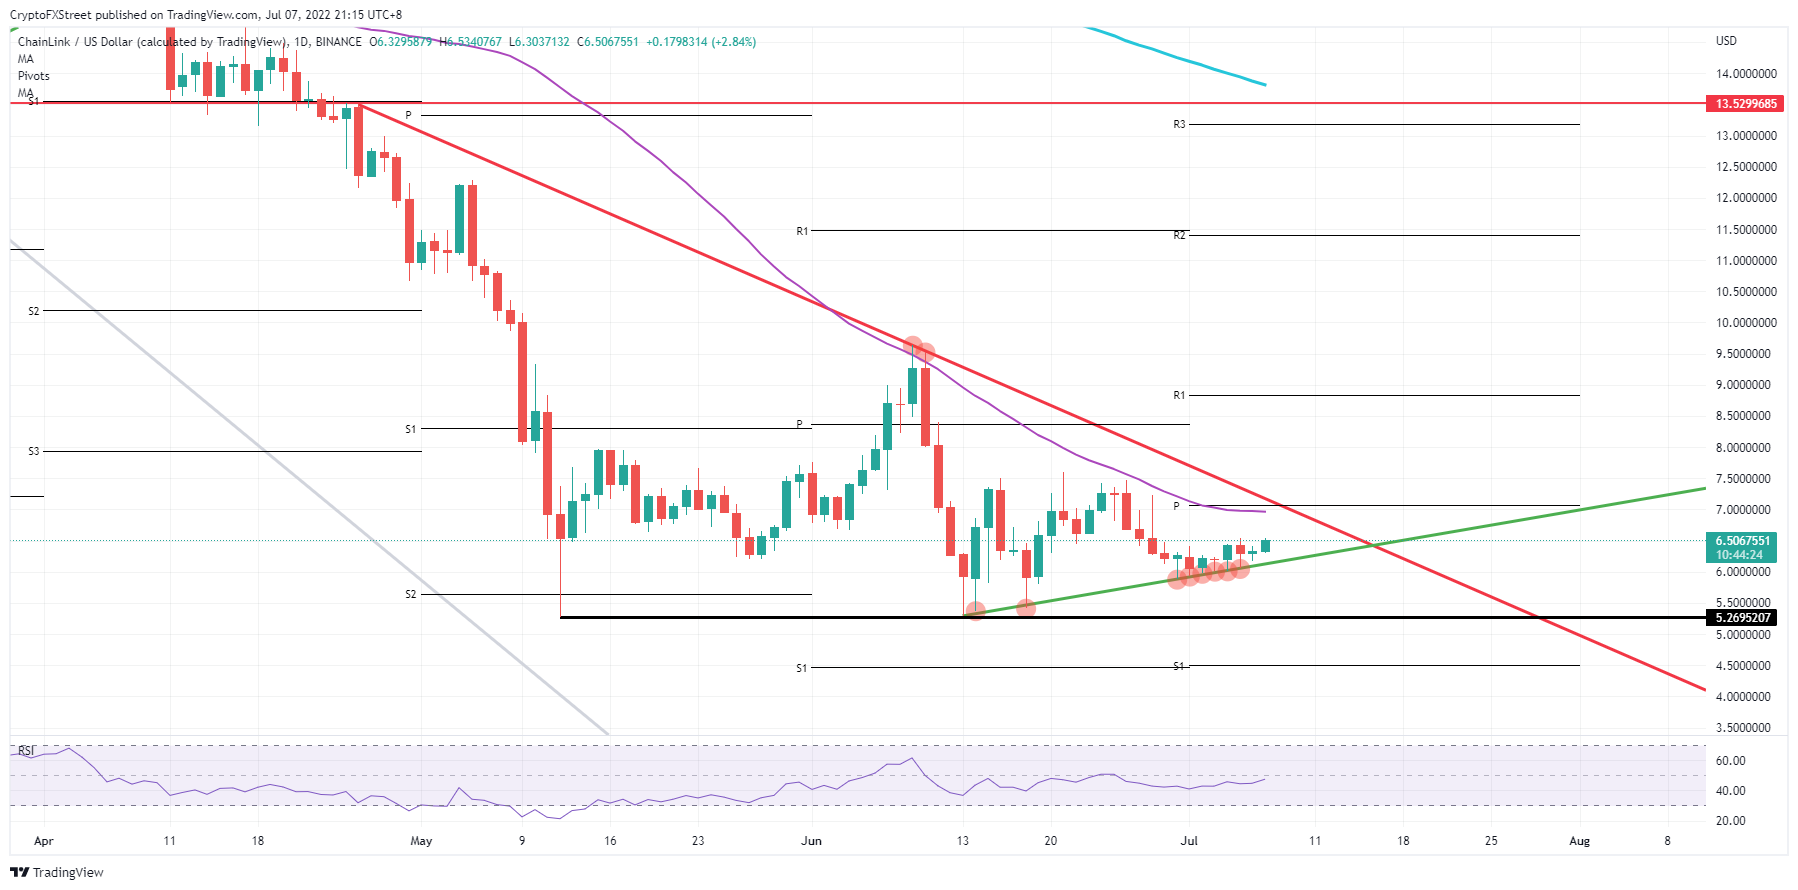
LINK/USD daily chart
Last, a bullish breakout from the pennant could also unfold. Certainly, seeing the soft patch that is currently hovering in cryptocurrencies with several pairs clawing back a bit and tieing up with consecutive small gains. This would mean that not only does the red descending trend line get broken, but the 55-day Simple Moving Average is around $7.00 also. From there, a rally could be booted and try to square the gap between the 55-day SMA and the 200-day SMA, hitting $13.53, which is also a pivotal historical level.
Author

Filip Lagaart
FXStreet
Filip Lagaart is a former sales/trader with over 15 years of financial markets expertise under its belt.



