Why you should not panic sell Zilliqa at current price levels
- Zilliqa price crashed roughly 69% from its all-time high at $0.230 on April 1.
- ZIL might rally 37%, providing a better opportunity to short at the retest of the $0.097 to $0.121 breaker.
- If the altcoin produces a daily candlestick close above $0.121, it will invalidate the bearish thesis.

Zilliqa price continues to descend after breaching below a crucial area of support. The current downswing might have reached its temporary bottom and is likely to reverse, allowing investors a chance to offload their holdings. However, this potential upswing will also provide sellers to open short positions on ZIL.
Zilliqa price provides more opportunities
Zilliqa price plummeted roughly 69% from its all-time high at $0.230. This downswing comes after a 400% upswing in late March. The resulting nosedive bounced off the $0.097 to $0.121 demand zone for quite some time in April but breached below it on April 26.
This breakdown of the said barrier comes after ZIL produced a market structure break on March 30, which flipped the demand zone into a bearish breaker. This technical formation has trapped underwater buyers who are waiting for a chance to offload their holdings.
Therefore, any subsequent retests of the bearish breaker are likely going to result in a spike in selling pressure and hence a downward move. So far, there have not been any retests of the breaker. However, as Bitcoin price reverses, there is a good chance Zilliqa price will do the same.
In such a case, investors can expect ZIL to rally 37% from its current position at $0.070 to retest the breaker. Interested investors can open a short position here and put their stop-losses at the breaker’s upper limit at $0.121.
The resulting selling pressure after a breaker’s retest is likely to trigger Zilliqa price to crash roughly 48% to $0.050. This move will fill the price inefficiency known as the Fair Value Gap (FVG) that extends from $0.068 to $0.050.
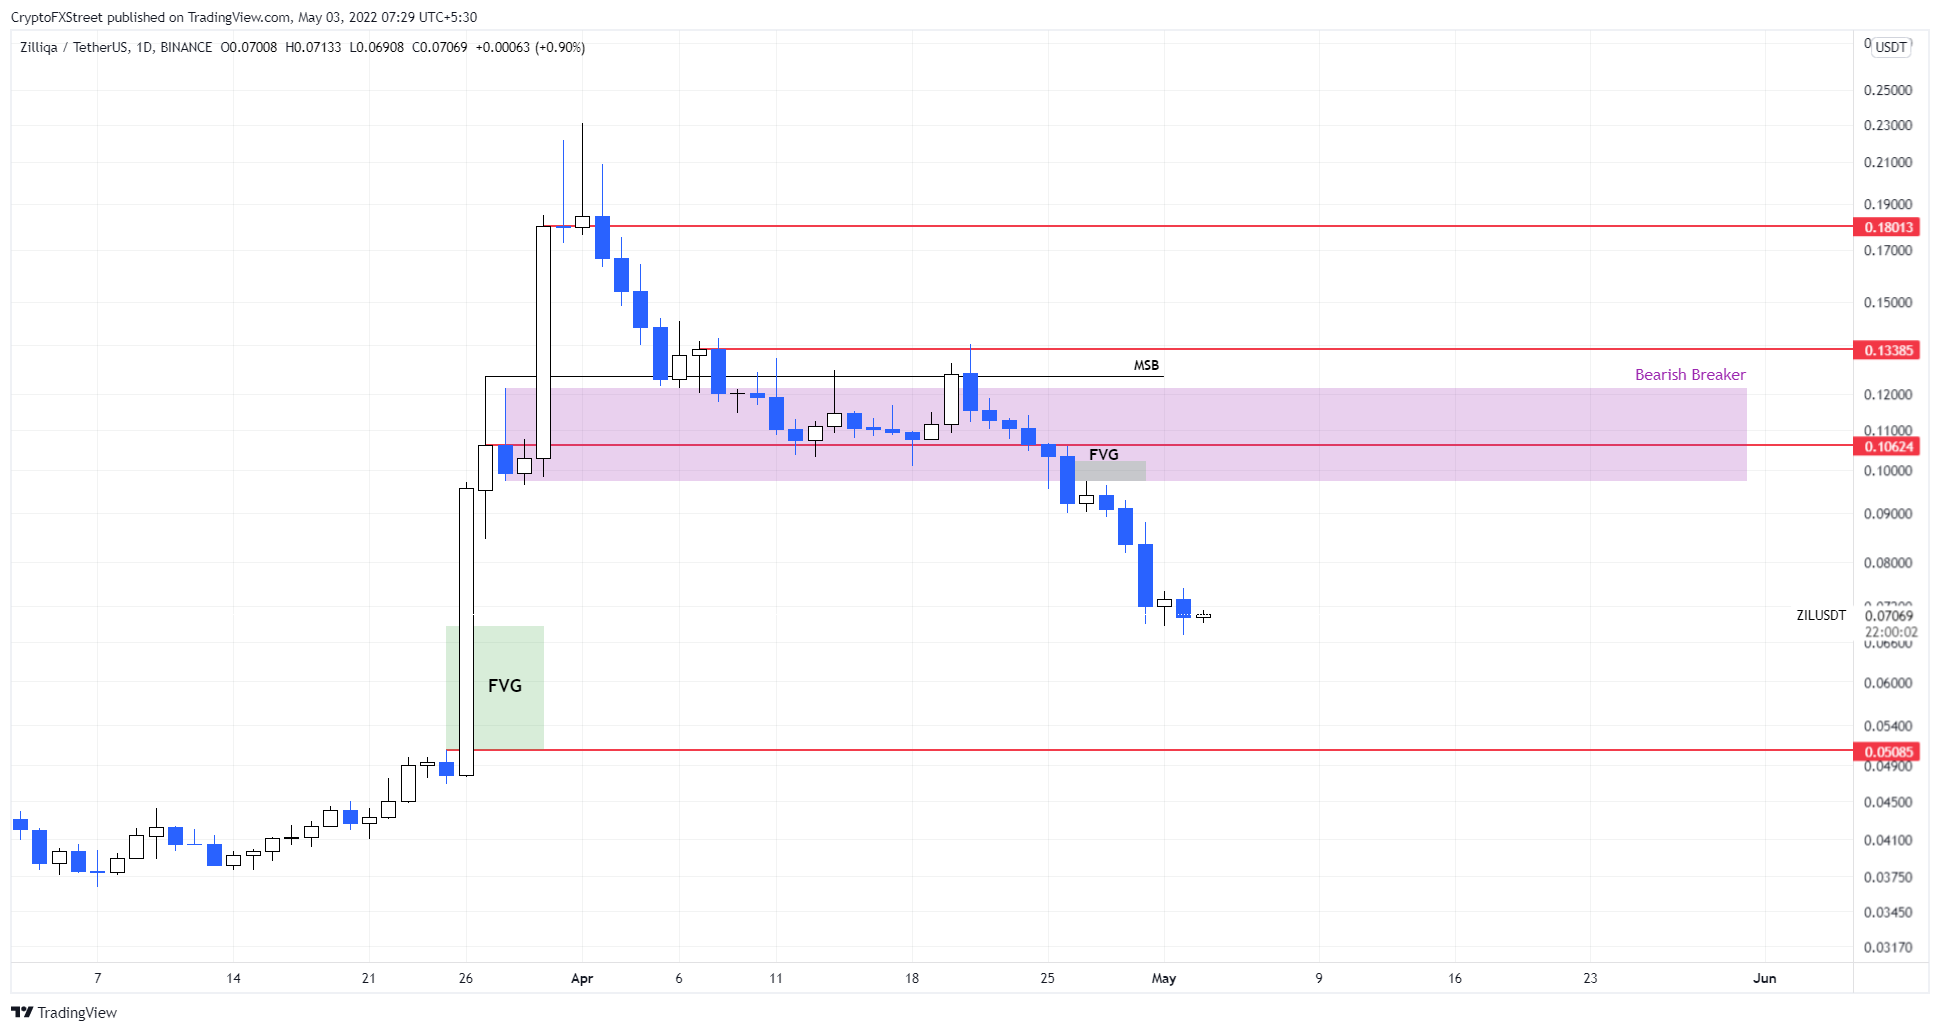
ZIL/USDT 1-day chart
Regardless of the bearish outlook, there will be an opportunity for investors to offload their holdings due to the incoming rally. A much more optimistic outlook for ZIL will arrive after a daily candlestick close above $0.121. This move will invalidate the bearish thesis for Zilliqa price and potentially kick-start a 12% upswing to $0.133.
Author

Akash Girimath
FXStreet
Akash Girimath is a Mechanical Engineer interested in the chaos of the financial markets. Trying to make sense of this convoluted yet fascinating space, he switched his engineering job to become a crypto reporter and analyst.


