Why XRP price is ready for a new all-time high to $4
- XRP price is ready for a leg up after months of consolidation.
- Ripple bulls are planning a comeback as the token prepares for a rally toward $4.
- Only a slice above $1.95 could confirm the asset’s bullish intentions.

XRP price has formed a massively bullish chart pattern on the weekly chart, suggesting an optimistic target for Ripple near $4. However, investors should note that the governing technical pattern is still in the making, and only a critical close above $1.95 could unlock the token’s tremendous potential.
XRP price reveals massive bullish pattern
XRP price has set up a cup-and-handle pattern on the weekly chart, with a measured move of 94% toward $3.85 from the neckline of the formation. Moving forward, Ripple must slice above $1.95, the neckline of the pattern for the optimistic target to be on the radar.
However, XRP price may face ample resistance before reaching the neckline of the governing technical pattern. The first obstacle for Ripple is at the September 6 high at $1.39, then at the May 17 high at $1.71, coinciding with the resistance line given by the Momentum Reversal Indicator (MRI).
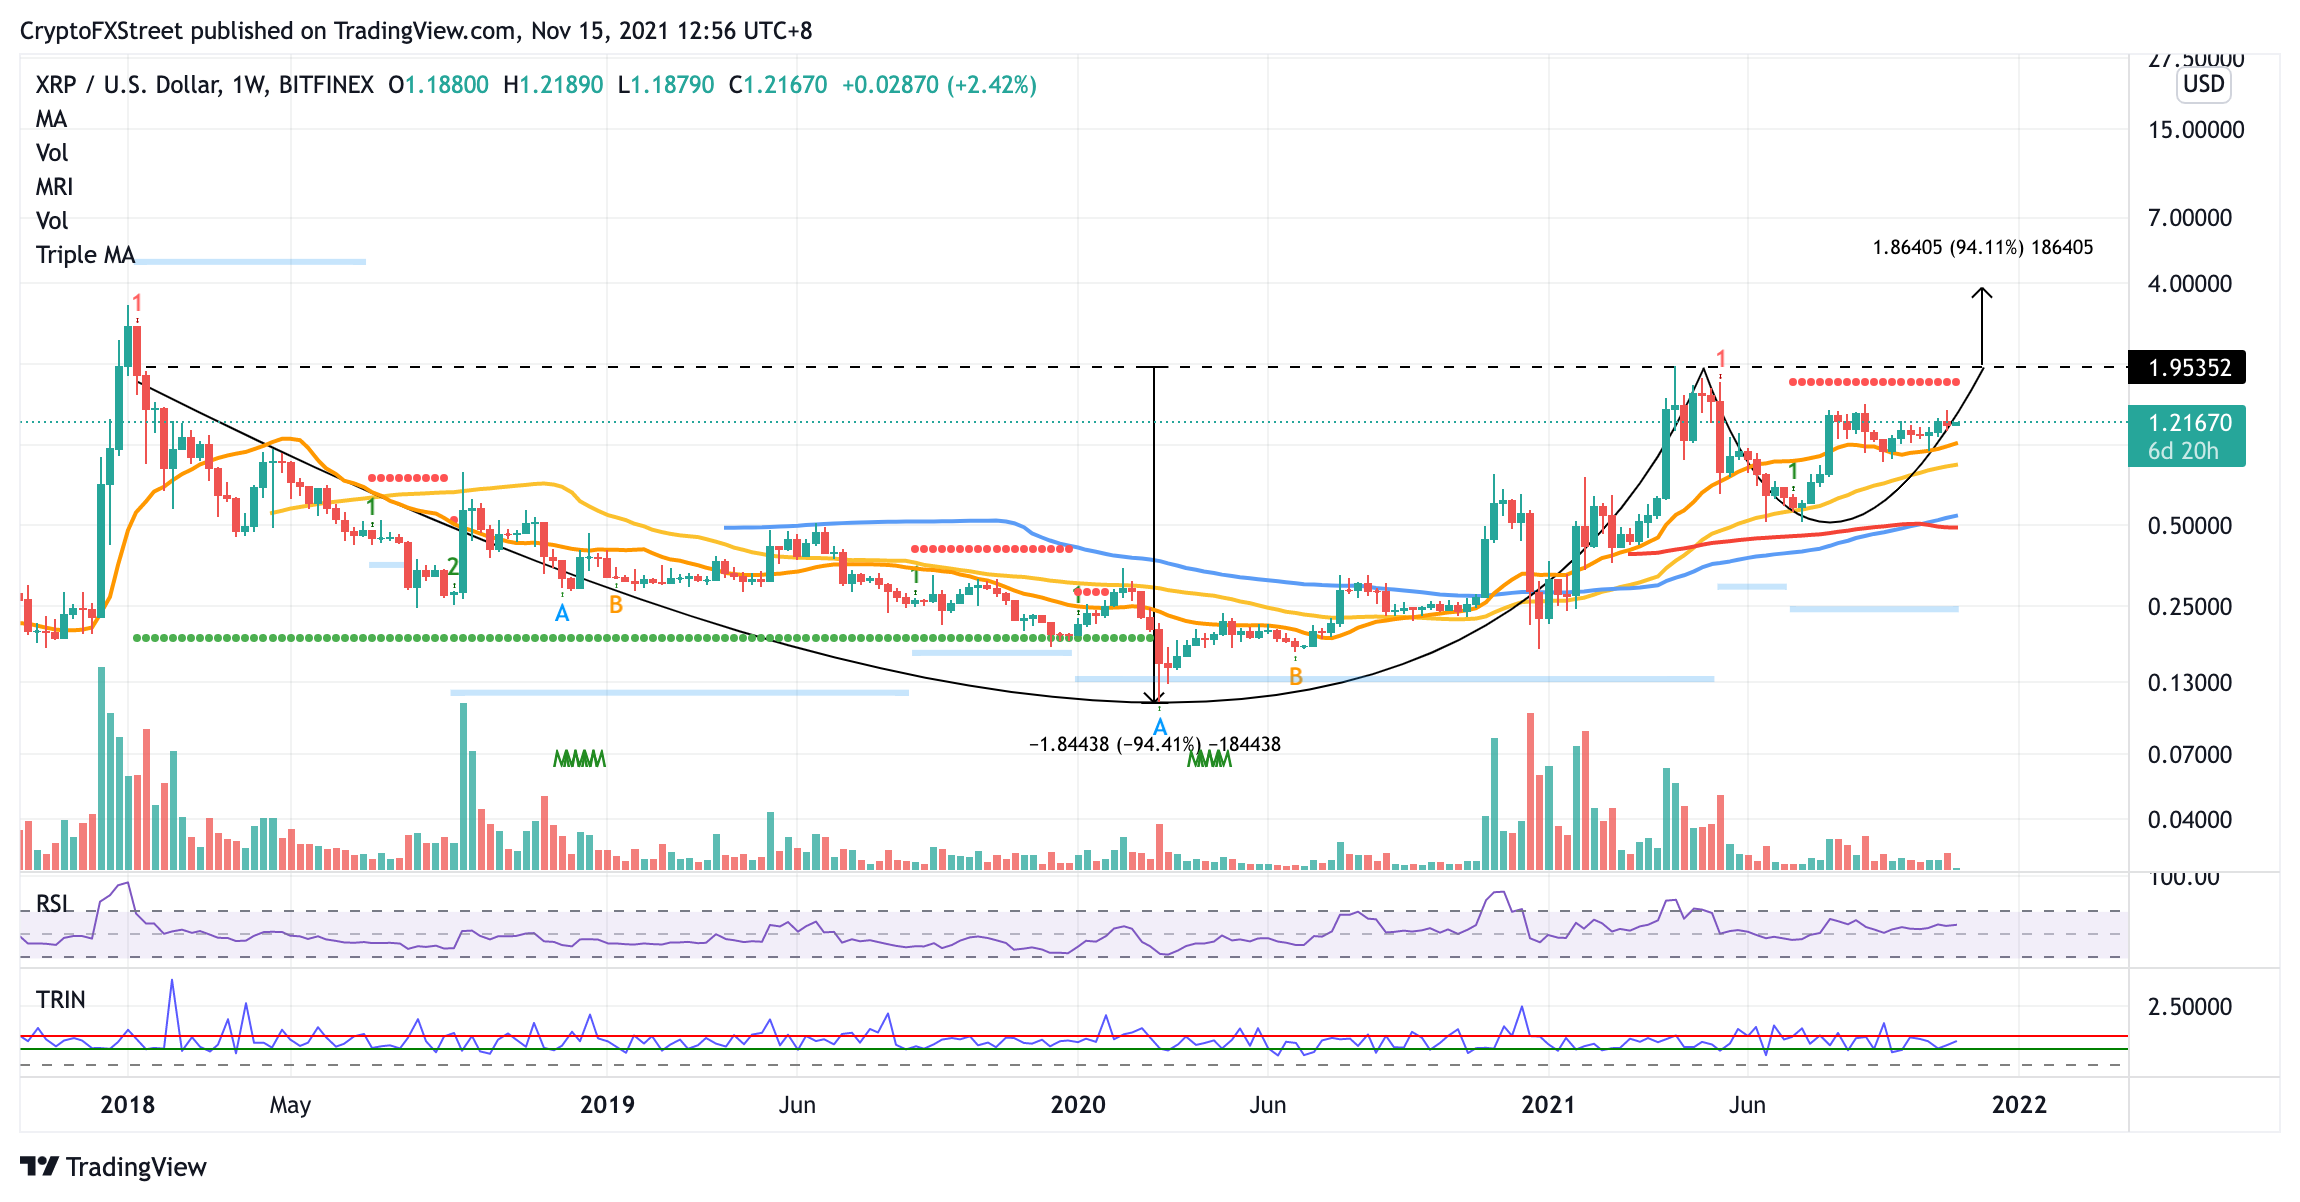
XRP/USD weekly chart
Only a slice above the last hurdle at $1.95, the topside trend line of the prevailing chart pattern, would ignite an explosive rally toward $3.85, recording a new all-time high for XRP price.
On the daily chart, XRP price appears to be nearing a critical trend line that has acted as resistance for Ripple since April 16. If Ripple manages to slice above the line of resistance at $1.23, coinciding with the 50% retracement level, further bullish intentions for the token may unravel.
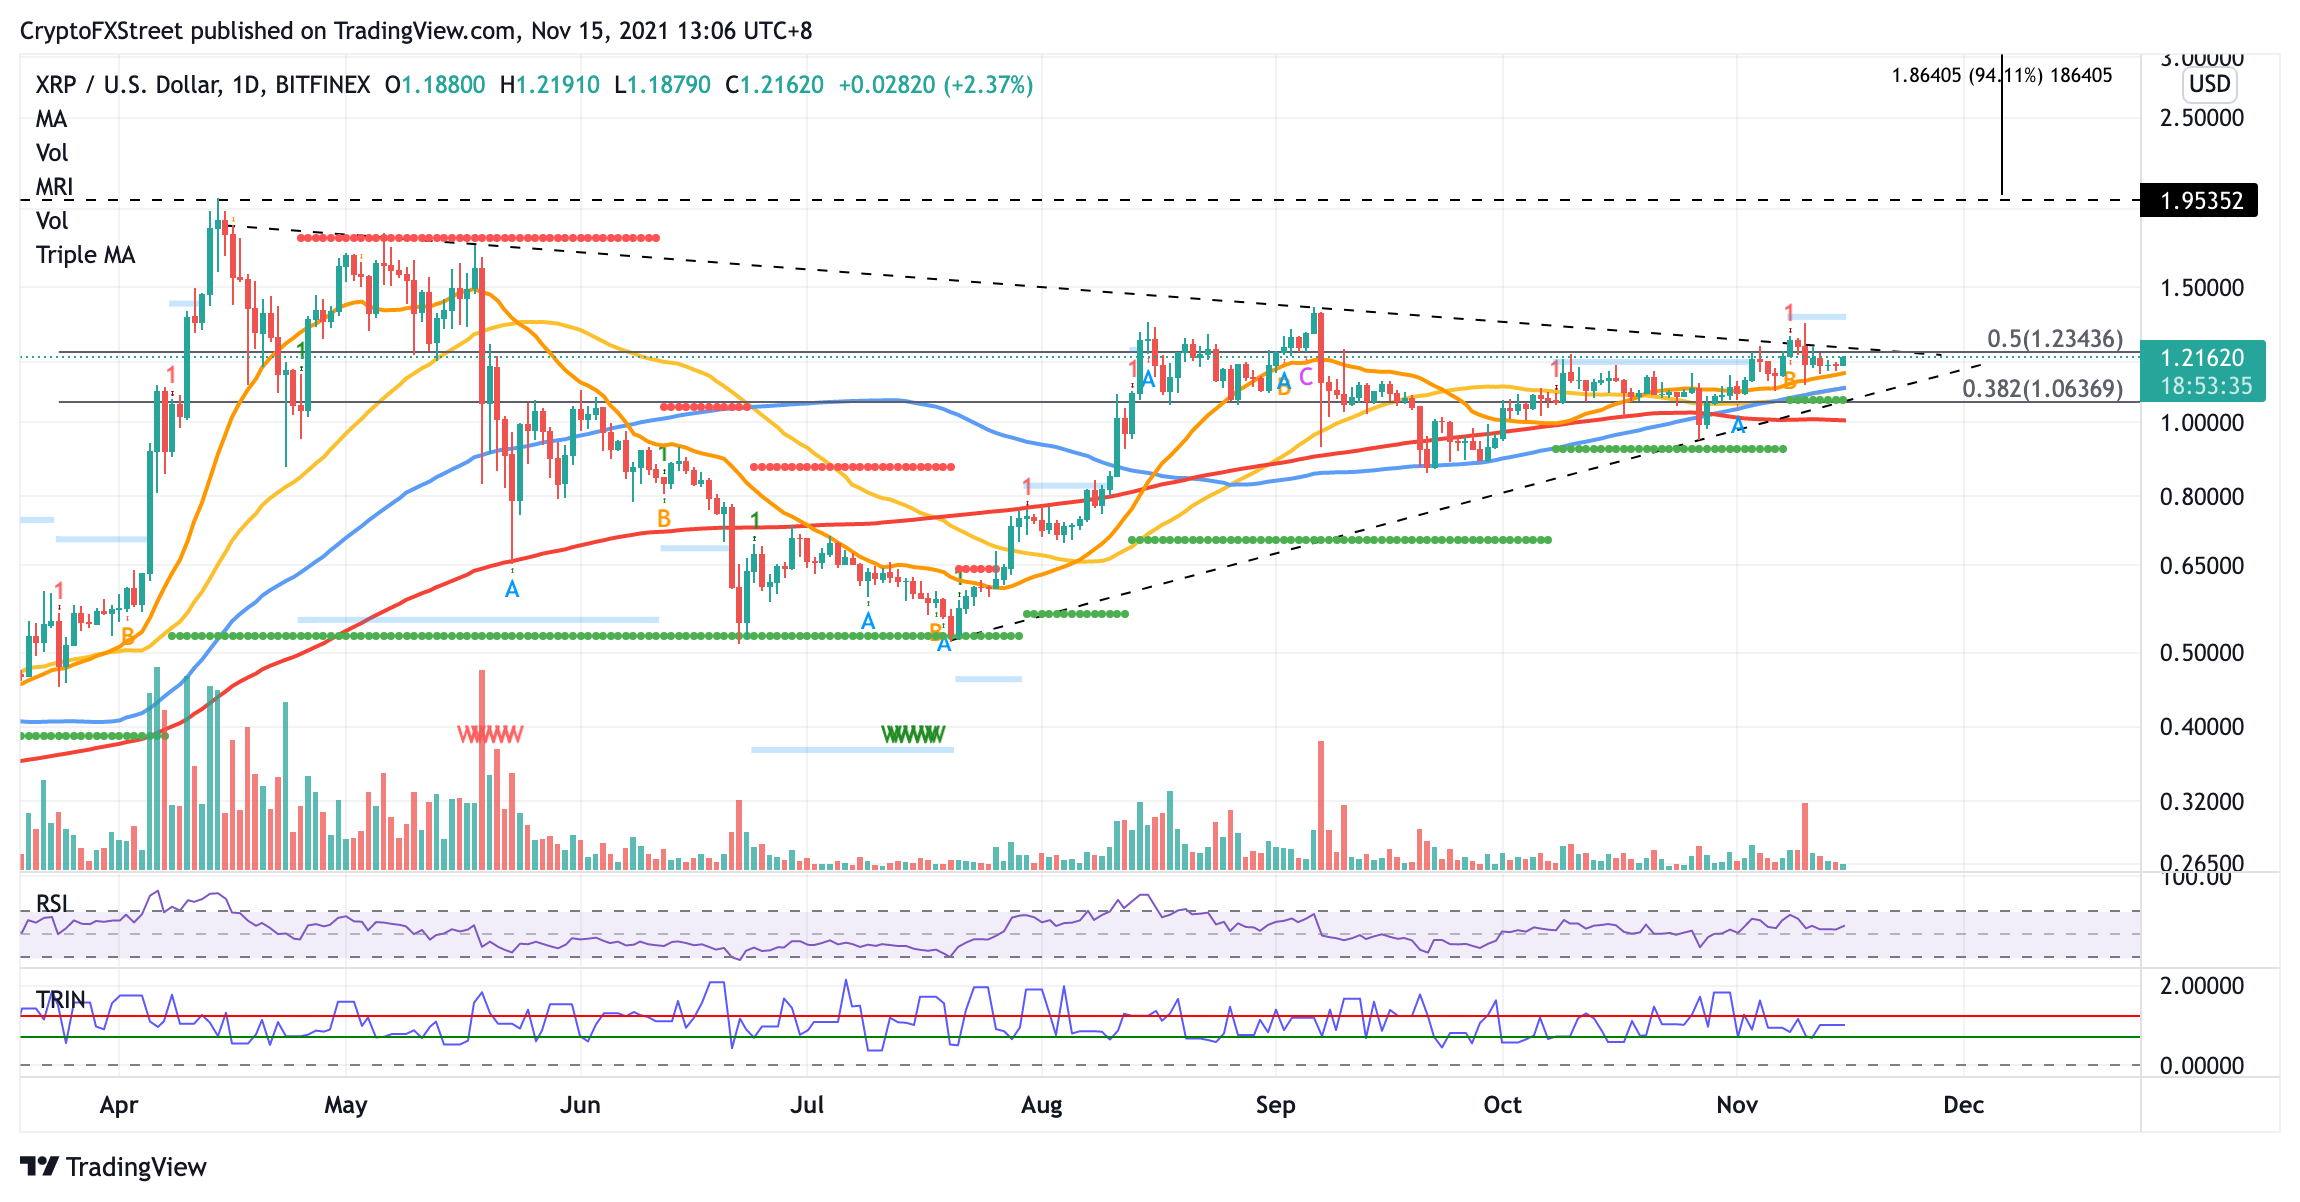
XRP/USD daily chart
If a spike in sell orders occurs, XRP price may discover immediate support at the 21-day Simple Moving Average (SMA) at $1.15, then at the 100-day SMA at $1.10. Additional foothold may emerge at a technical confluence at $1.06, where the 38.2% Fibonacci retracement level, 50-day SMA, support line given by the MRI and the ascending support trend line meet.
Dipping below the aforementioned foothold may be dangerous for the bulls and XRP price may continue to consolidate.
Author

Sarah Tran
Independent Analyst
Sarah has closely followed the growth of blockchain technology and its adoption since 2016.



