Why the Shiba Inu price could be a great short for day trading bears
- Shiba Inu price shows declining volume with each countertrend rise.
- The Relative Strength Index breached oversold territories and has yet to rise into the opposite extreme.
- Invalidation of the bearish thesis is a breach above September's monthly high.
Shiba Inu price shows substantial evidence that bears are in control and will soon force the notorious dog coin into lower prices.
Shiba Inu price is likely to fail
Shiba Inu price is having difficulty rising to higher targets. During September, the infamous meme coin's performance was highly unstable as traders encountered shakeouts and fakeouts in both directions. Although the SHIB price has been a more challenging digital asset to trade, there may be an opportunity to short the digital asset in the coming days,
Shiba Inu currently trades at $0.00001100. The cumulative volume has tapered during each countertrend spike in the market. According to the Volume Profile analysis, this supports the idea of a faltering trend. Additionally, structural resistance can be spotted on the Shiba Inu price at the $0.00001150 and $0.00001100 levels. The Relative Strength Index breached extremely oversold territories on the previous decline in June and has yet to rally into the opposite extreme.
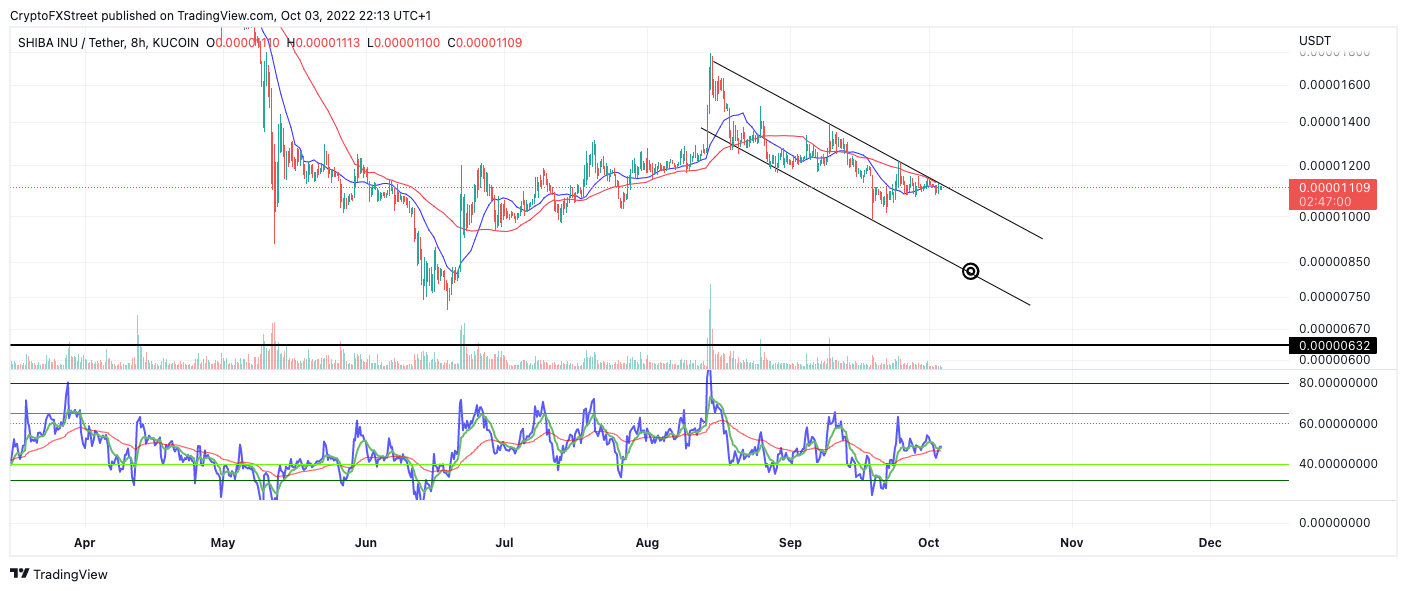
SHIB/USDT 8-Hour Chart
By combining these factors, Shiba Inu price will likely remain bearish unless the September swing high at $0,00001393 is breached. However, for traders with a keen eye, an entry near current price levels could be justifiable in the coming hours as the recently rejected 21-day simple and 8-day exponential moving averages could produce a bearish death cross.
If the cross occurs, a breach of the September low at $0.00000992 is highly probable. Additional targets could be near the June 18 thrust candle at $0.00000820, resulting in a 25% decrease from the current Shiba Inu price.
In the following video, our analysts deep dive into the price action of Shiba Inu, analyzing key levels of interest in the market. -FXStreet Team
Author

Tony M.
FXStreet Contributor
Tony Montpeirous began investing in cryptocurrencies in 2017. His trading style incorporates Elliot Wave, Auction Market Theory, Fibonacci and price action as the cornerstone of his technical analysis.


