Shiba Inu Price Prediction: A downwards dog can only bend so far
- Shiba Inu price has lost 25% of market value this month.
- SHIBA price has lost support from both the 8-day exponential and 21-day simple moving averages.
- Invalidation of the bearish thesis can occur if the bulls produce a daily settlement above $0.00001131.
Shiba Inu price shows a steepening decline as the weeks progress. A sweep of the summertime lows is possible.
Shiba Inu price is picking up momentum
Shiba Inu price is down 25% since the high at $0.00001395 was established during the first week of September. The bears have been trotting south, forging a progressively steeper decline as the weeks have progressed.
Shiba Inu price currently auctions at $0.00001062. The notorious meme coin has been suppressed into a previous accumulation zone before the late summer rally. Based on Wyckoff's methodology, the dog has gone too far. A sweep-the-lows event targeting the June 18 swing low could be underway in the coming days. Such a move would result in a further 30% decline.
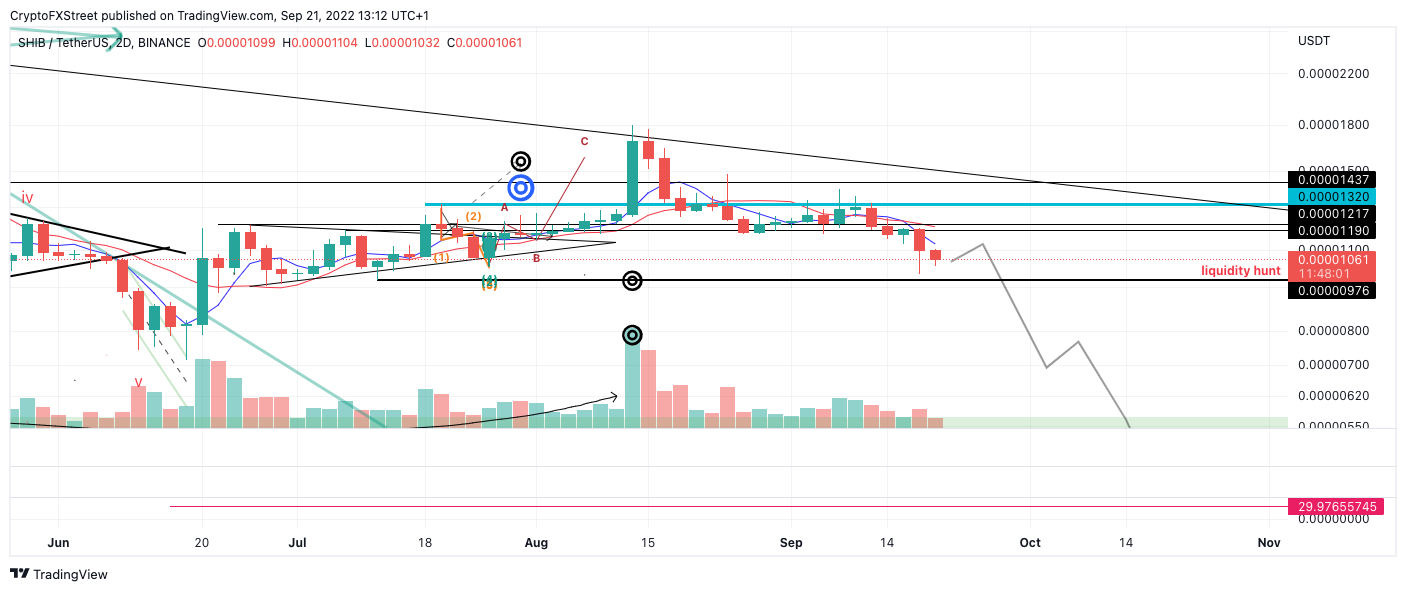
SHIB USDT 2-Day Chart
The Volume Profile Indicator compounds the developing bearish thesis as the bulls have yet to retaliate with equal force in terms of transactions and price action compared to the red days within the trend. Additionally, the bulls have lost support from the 8-day exponential and 21-day simple moving average, which could be the catalyst to a penny-from-Eiffel style decline.
Invalidation of the bearish thesis can occur if the bulls re-hurdle and stay above the 8-day exponential moving average currently positioned at $0.00001131. In doing so, a countertrend pullback could occur, targeting previous support zones at $0.00001200, resulting in a 12% increase from the current Shiba Inu price.
In the following video, our analysts deep dive into the price action of Shiba Inu, analyzing key levels of interest in the market. -FXStreet Team
Author

Tony M.
FXStreet Contributor
Tony Montpeirous began investing in cryptocurrencies in 2017. His trading style incorporates Elliot Wave, Auction Market Theory, Fibonacci and price action as the cornerstone of his technical analysis.


